Exploring OpenTelemetry Demo Application with SigNoz
Ever fixed a bug only for it to reappear in prod like a ghost? Let’s recreate those hair-pulling scenarios with the OpenTelemetry Demo App and debug them back to sanity with SigNoz.
Everyone knows that debugging is twice as hard as writing a program in the first place. So, if you’re as clever as you can be when you write it, how will you ever debug it?
— Brian W. Kernighan and P. J. Plauge, The Elements of Programming Style, 2nd ed.
Maybe you can let SigNoz do some heavy lifting for you!
Introducing The OpenTelemetery [OTel] Demo Application
OpenTelemetry Demo Application is a robust project created and maintained by the OpenTelemetry community as a quick start for anyone trying to experiment with OpenTelemetry, the open-source observability standard. It is also a great reference as it presents a distributed system with 15 core micro-services in a polyglot environment, with services written in Go, Python, .NET, Java, etc., talking to each other over gRPC and HTTP.
What appears to be a simple astronomy online shop to purchase stargazing tools is a full-fledged project developed with the intention of allowing developers to explore a production-lite deployment with built-in capability to simulate failures with flags and a load generator to fake user traffic. It comes fully instrumented with OpenTelemetry client libraries and an OpenTelemetry Collector to collect all the telemetry data, aggregate, process it, and forward it to a backend of your choice.
Here, we will be using SigNoz as our backend for observability.
Why SigNoz?
It is designed from the ground up to integrate with OpenTelemetry seamlessly and is open source. This native compatibility ensures that SigNoz can fully leverage the rich, standardised data produced by OpenTelemetry without requiring complex workarounds or additional translation layers. This holistic approach simplifies debugging and performance analysis by allowing developers to correlate logs, traces, and metrics effortlessly.
Since SigNoz is OpenTelemetry native - the process of configuring applications and projects to send telemetry data to it is hassle-free and simple, which we will experience as we set up the OTel Demo App to send logs, metrics and traces to SigNoz.
Send OpenTelemetry Demo App Telemetry to SigNoz
The easiest way to send data to SigNoz is via the cloud. This is a quick guide for sending data to the SigNoz cloud using docker deployment of the OTel Demo App. Instead, if you wish to send data to self hosted versions of SigNoz (Docker/ Kubernetes) check our docs.
Get your SigNoz Cloud Endpoint
Sign up or log in to SigNoz Cloud
Generate a new ingestion key within the ingestion settings. This token will serve as your authentication method for transmitting telemetry data.
Clone Github Repo for OTel Demo App
Clone the OTel demo app to any folder of your choice.
# Clone the OpenTelemetry Demo repository
git clone https://github.com/open-telemetry/opentelemetry-demo.git
cd opentelemetry-demo
Configuring OTel Collector
By default, the collector in the demo application will merge the configuration from two files:
otelcol-config.yml [we don't touch this]
otelcol-config-extras.yml [we modify this]
To add SigNoz as the backend, open the file src/otel-collector/otelcol-config-extras.yml and add the following,
exporters:
  otlp:
    endpoint: "https://ingest.{your-region}.signoz.cloud:443"
    tls:
      insecure: false
    headers:
      signoz-ingestion-key: <SIGNOZ-INGESTIONKEY>
  debug:
    verbosity: detailed

service:
  pipelines:
    metrics:
      exporters: [otlp]
    traces:
      exporters: [spanmetrics, otlp]
    logs:
      exporters: [otlp]
Remember to replace the region and ingestion key with the proper values obtained from your account.
When merging extra configuration values with the existing collector config (
src/otel-collector/otelcol-config.yml), objects are merged, and arrays are replaced, resulting in previous pipeline configurations being overridden. If overridden, the span metrics exporter must be included in the array of exporters for the traces pipeline. Not including this exporter will result in an error.
Start the OTel Demo App
Get the OTel Demo App running with the following command,
docker compose up -d
This spins up multiple microservices with OpenTelemetry instrumentation enabled. You can verify this by,
docker compose ps -a
The result should look similar to this,
Monitor with SigNoz
Open your SigNoz account
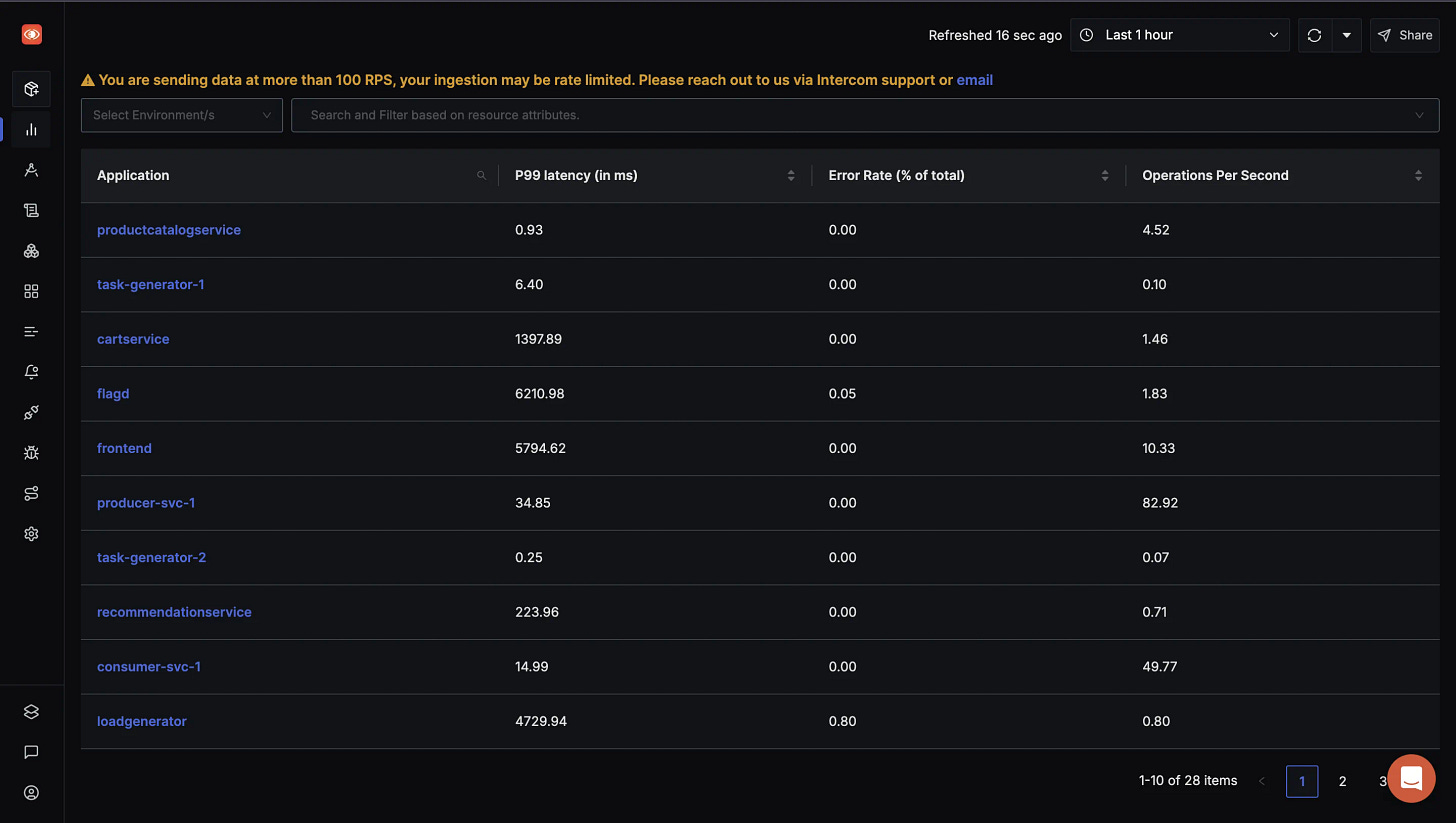
Navigate to Services to see multiple services listed down as shown in the snapshot below.
When you navigate to the Service Map tab, you see an automatically generated visualisation of your service architecture, as shown below.
Debugging Real-life Scenarios with SigNoz Simulated by the OTel Demo App
As developers, we are often paged for a bug and spend hours drowning in logs and metrics trying to figure out the root cause, only to realise after 7 hours of effort that it was a missed semi-colon. At SigNoz, we’ve made an honest attempt to make your debugging and monitoring strides a tad bit easier (or a whole lot more).
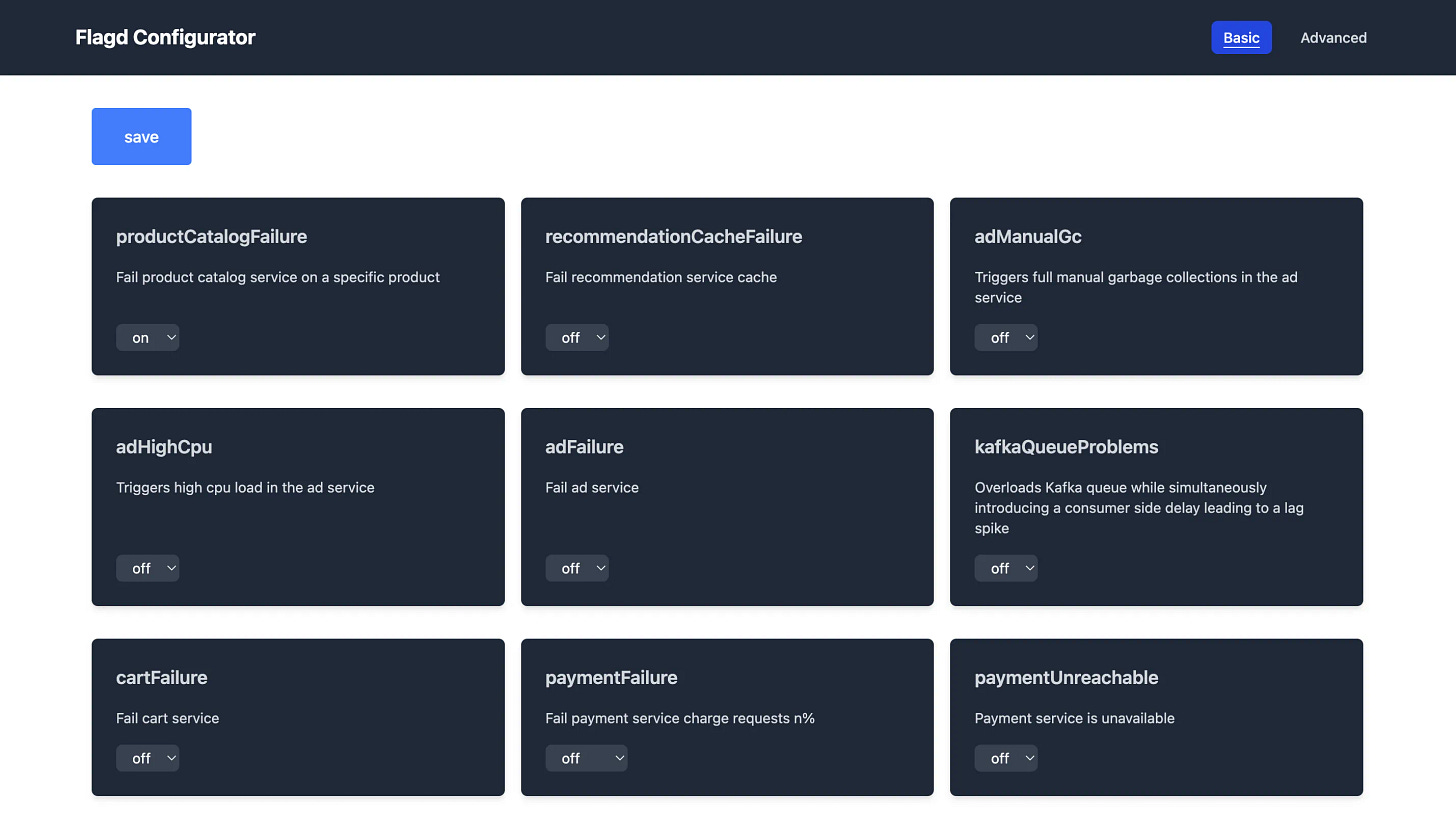
Let’s debug some very common bugs by using SigNoz and the OTel Demo App to simulate them. For this, navigate to http://localhost:8080/feature , which will look like the snapshot below. We will enable appropriate flags to simulate errors, in each of the following scenarios.
With the three scenarios below, we will look at how SigNoz implements traces, logs, metrics with dashboards and alerts, exceptions etc.
Monitoring a Kafka Consumer Lag
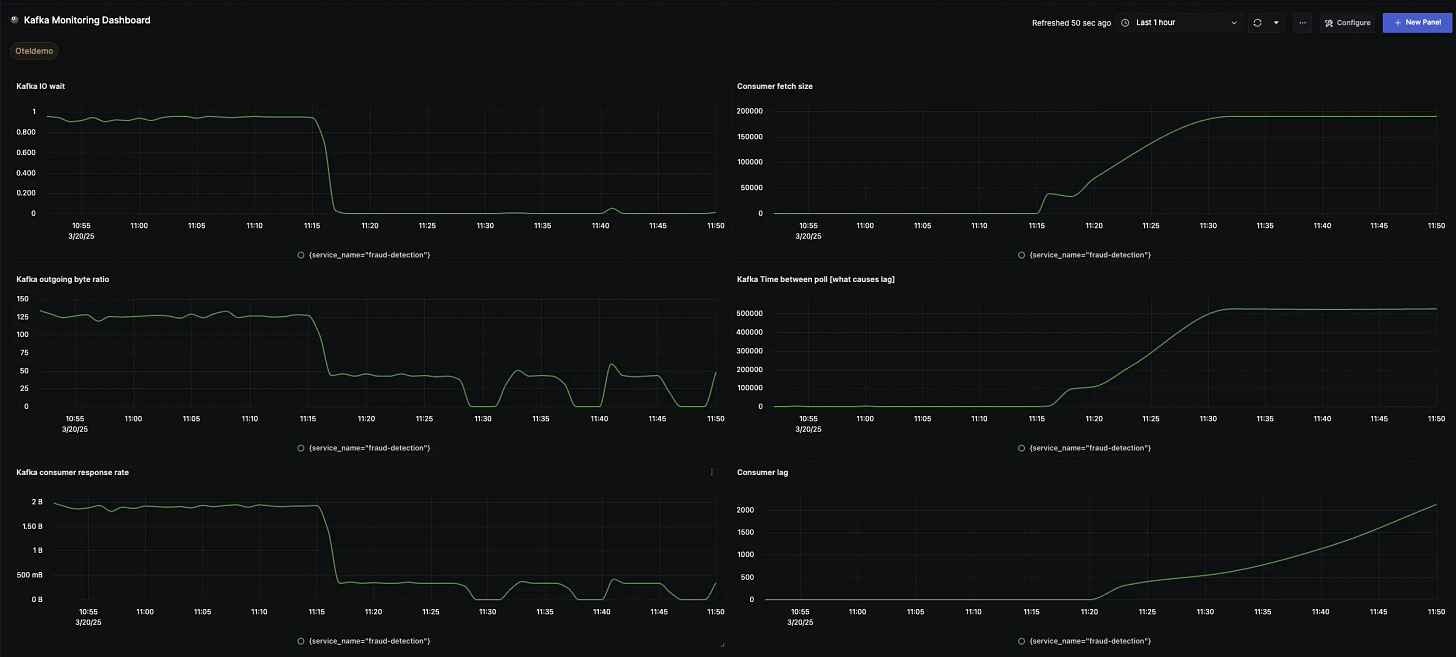
We are using a custom Kafka Monitoring dashboard here, which helps to monitor various metrics, including Kafka IO rate, Consumer lag, Fetch Size, etc. You can find the JSON here. Read this to understand in detail about SigNoz dashboards. Make sure to enable the KafkaQueueProblems flag as well. After a few minutes of waiting, we will observe upward spikes and downward tails in our dashboard, which points to anomalies needing inspection.
On closer inspection, the metrics going haywire indicate a Kafka Consumer lag, which results in increased time between polls. The downward tails on the Kafka IO Wait panel indicate a near-zero wait time, and the increasing fetch size on the Consumer Fetch Size panel indicates Kafka Queue Overload.
So, we have diagnosed two key anomalies - Consumer lag and Queue overload, which in a real-life scenario would require immediate debugging of the consumer/ producer code.
For our use case, the service map [check Service Map tab] shows that two services are consuming from Kafka, fraud detection and accounting.
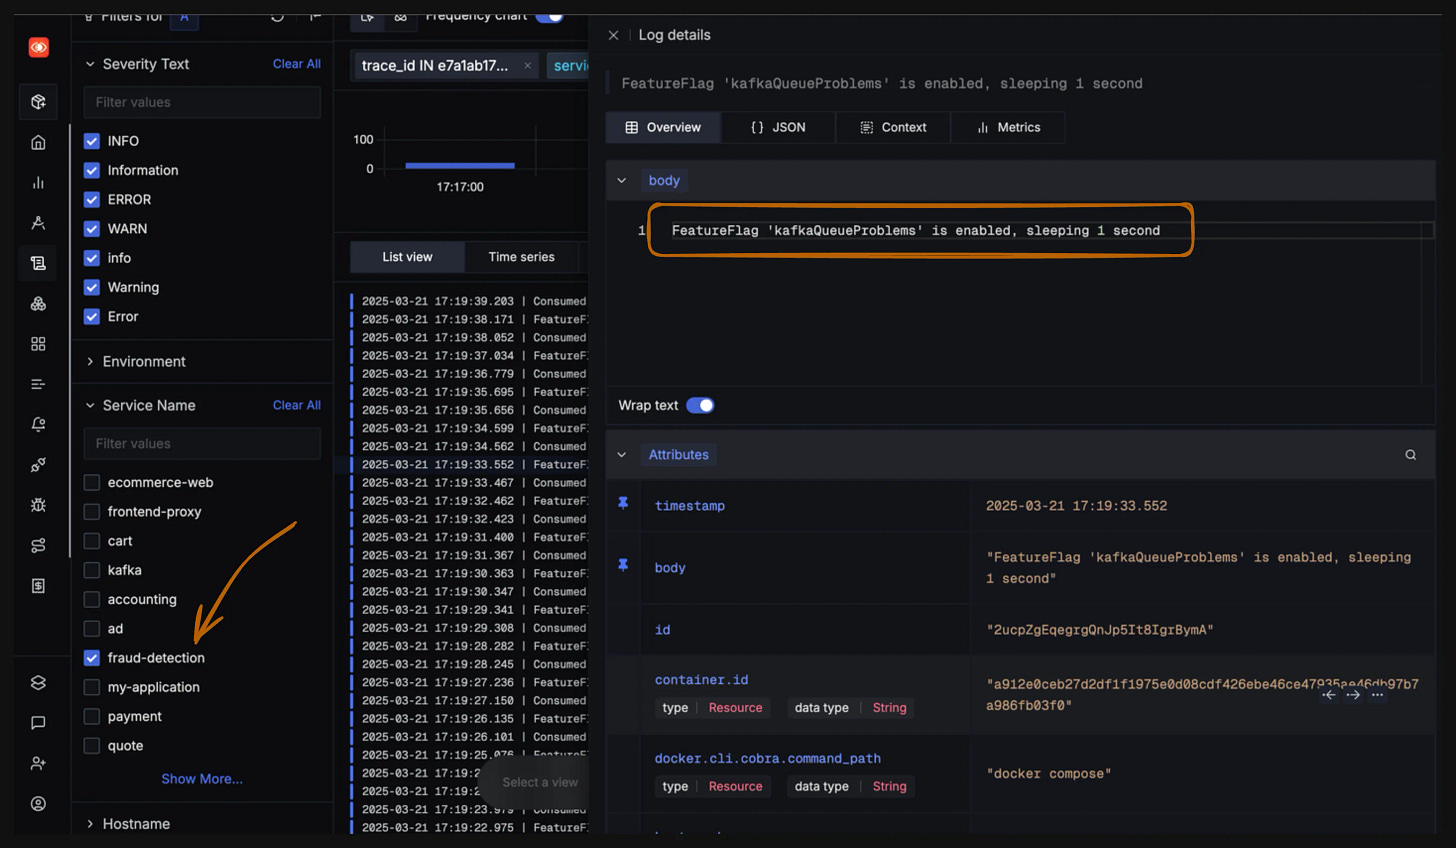
Going to the Logs Tab and filtering for logs from the fraud detection service is a good move at this point. From the logs, we see a particular statement: “FeatureFlag—kafkaQueueProblems is enabled, sleeping 1 second.”
This is the missing piece of our puzzle - the consumer delay caused by the service sleeping for a second, which causes the bottleneck.
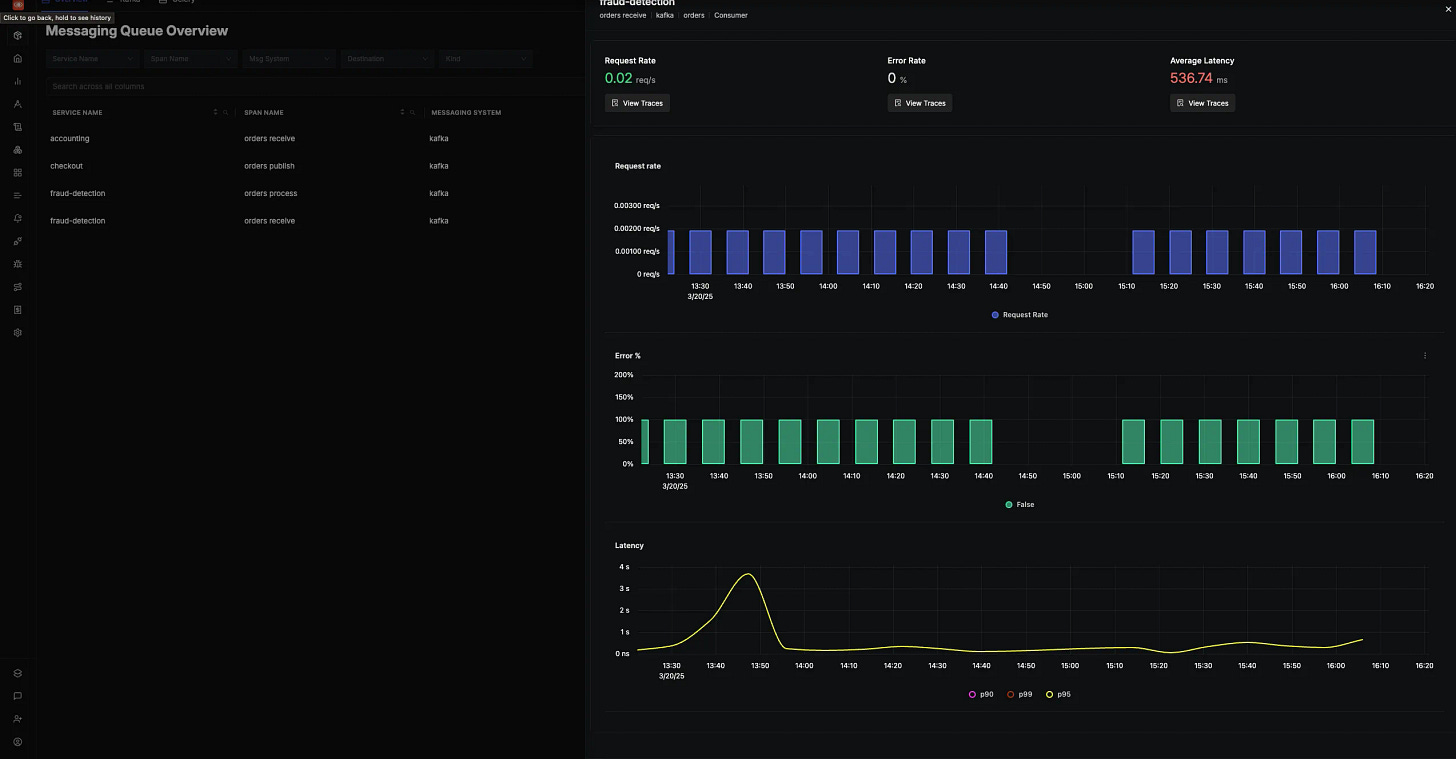
SigNoz also has a dedicated tab for Messaging Queues, where we can monitor the consumers of the Kafka topics and their stats. Currently, we support both Celery and Kafka Queues.
Investigating a Sporadic Service Failure
For this scenario, we have to enable the cartFailure flag. This flag will generate an error whenever we attempt to empty the cart. A few minutes after enabling this, we will observe that we are not able to empty the cart as expected.
In a real production environment, this type of issue represents a critical flaw in business logic that could potentially result in financial losses. The challenge is to identify and address the root cause rapidly.
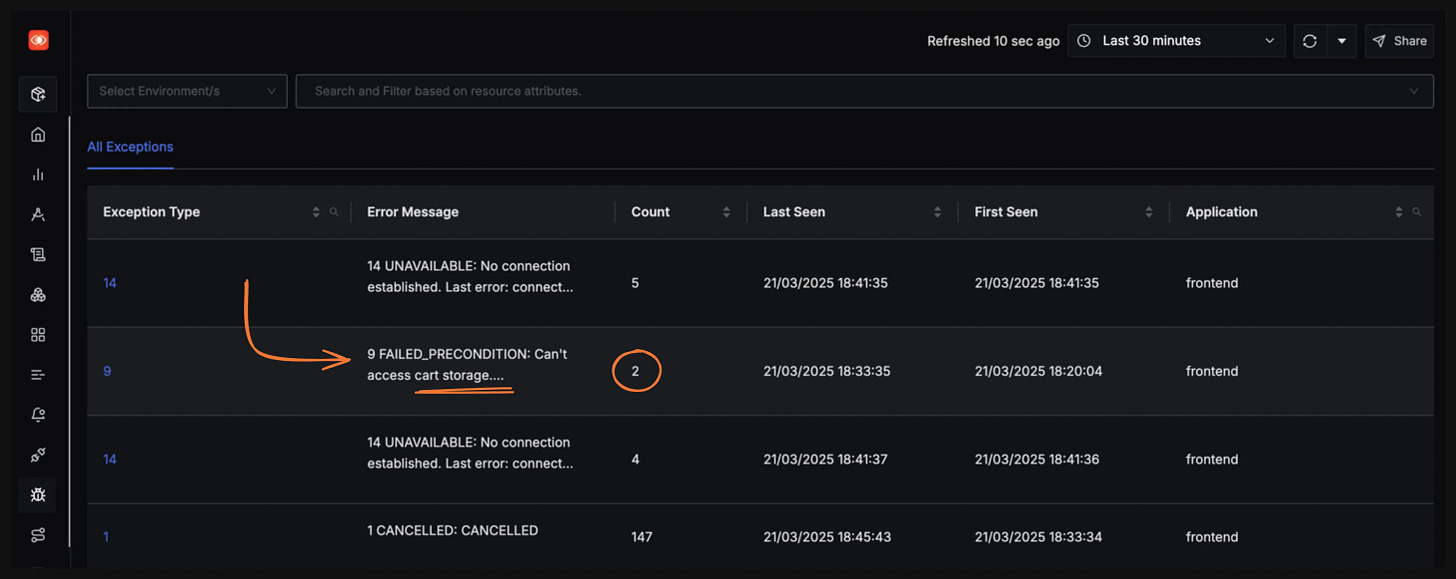
The Exceptions tab is a life-saver in such a situation. We immediately notice an exception statement referring to the cart, which is a good starting point for us.
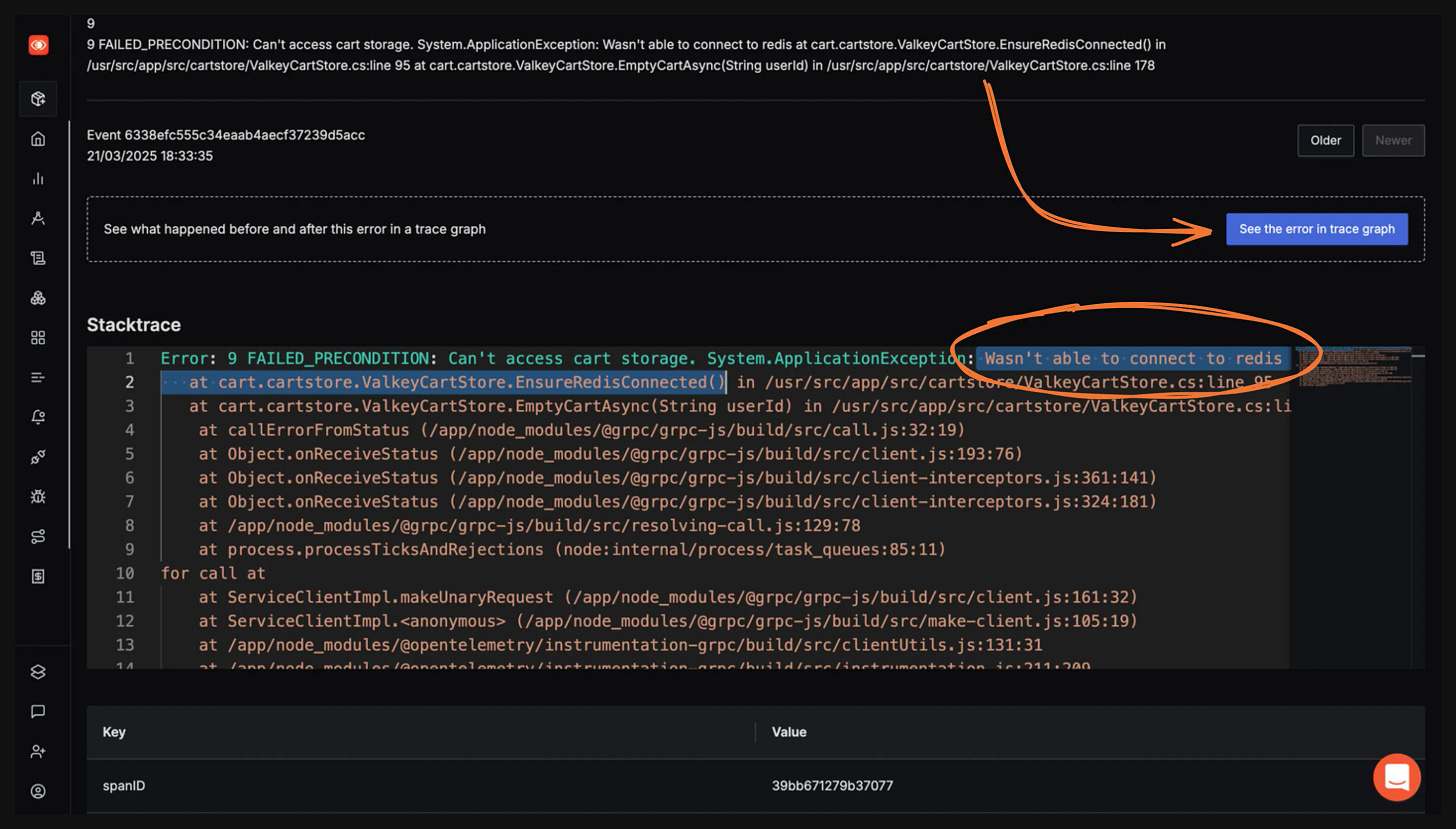
Diving deeper, we notice that the cartService is unable to connect to the Redis cache.
If you are a developer paged for this bug, the immediate next step is to restore the Redis connection and check if any other services have been similarly impacted.
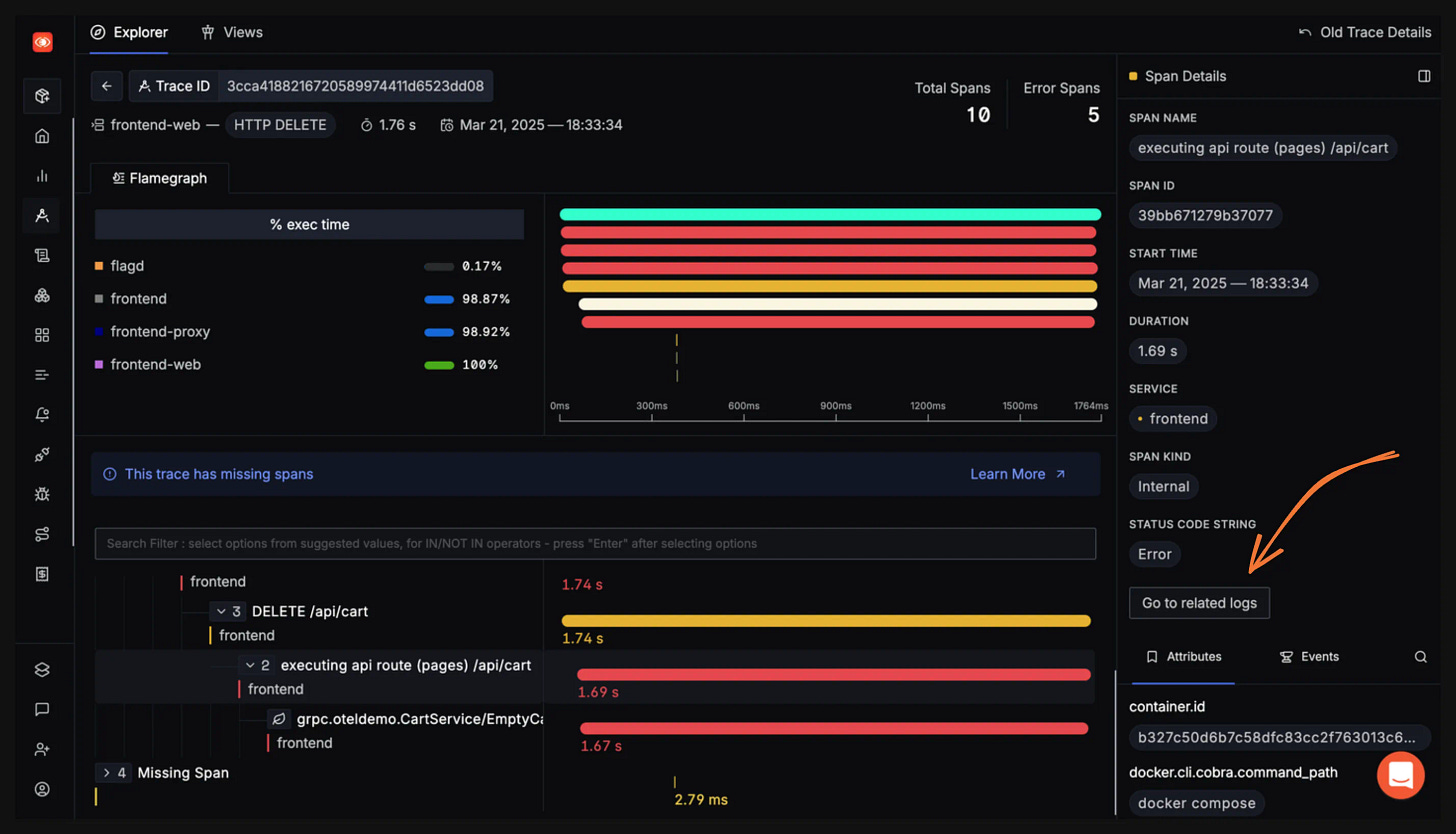
But to explore SigNoz further (this is purely for exploration and not a suggested or ideal debugging flow), click on ‘See the error in trace graph’. This takes us to the corresponding trace. Since traces always carry context, it often reduces debugging time. By clicking on ‘related logs‘, we can see OpenTelemetry log correlation in action, which works by connecting logs with traces through shared context identifiers.
Thus, we have not only debugged the issue quickly, but we have also drawn sufficient context around the issue.
When OpenTelemetry instruments your application, it creates unique trace and span IDs for tracking request flows. These same identifiers can be automatically injected into your logs, creating a direct link between your traces and related log entries.
Getting to the bottom of a ProductCatalogue Error
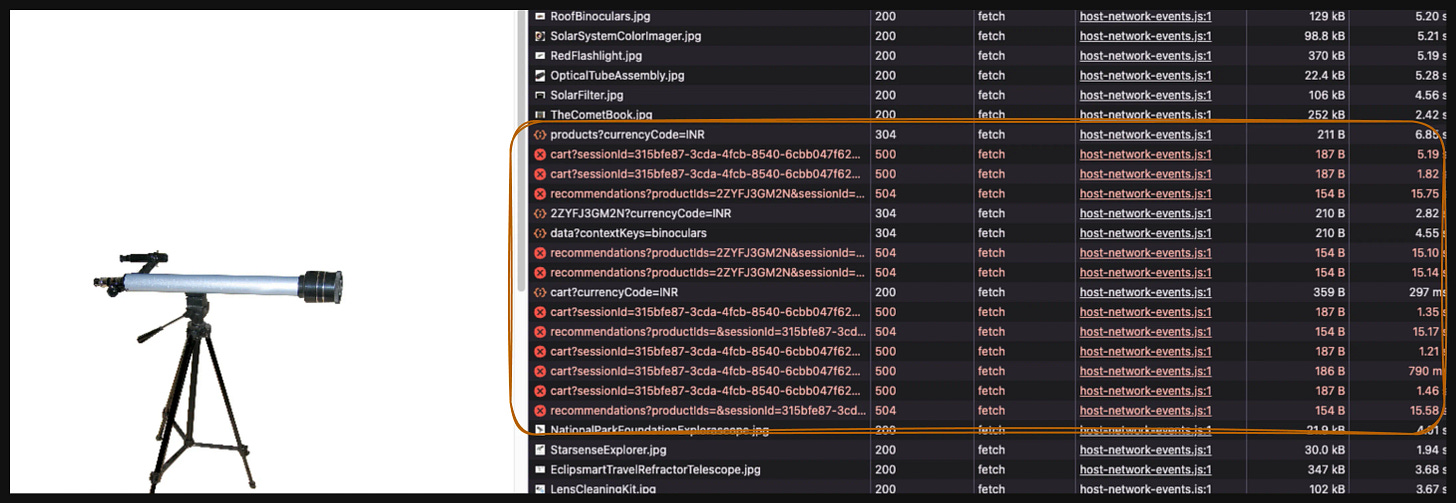
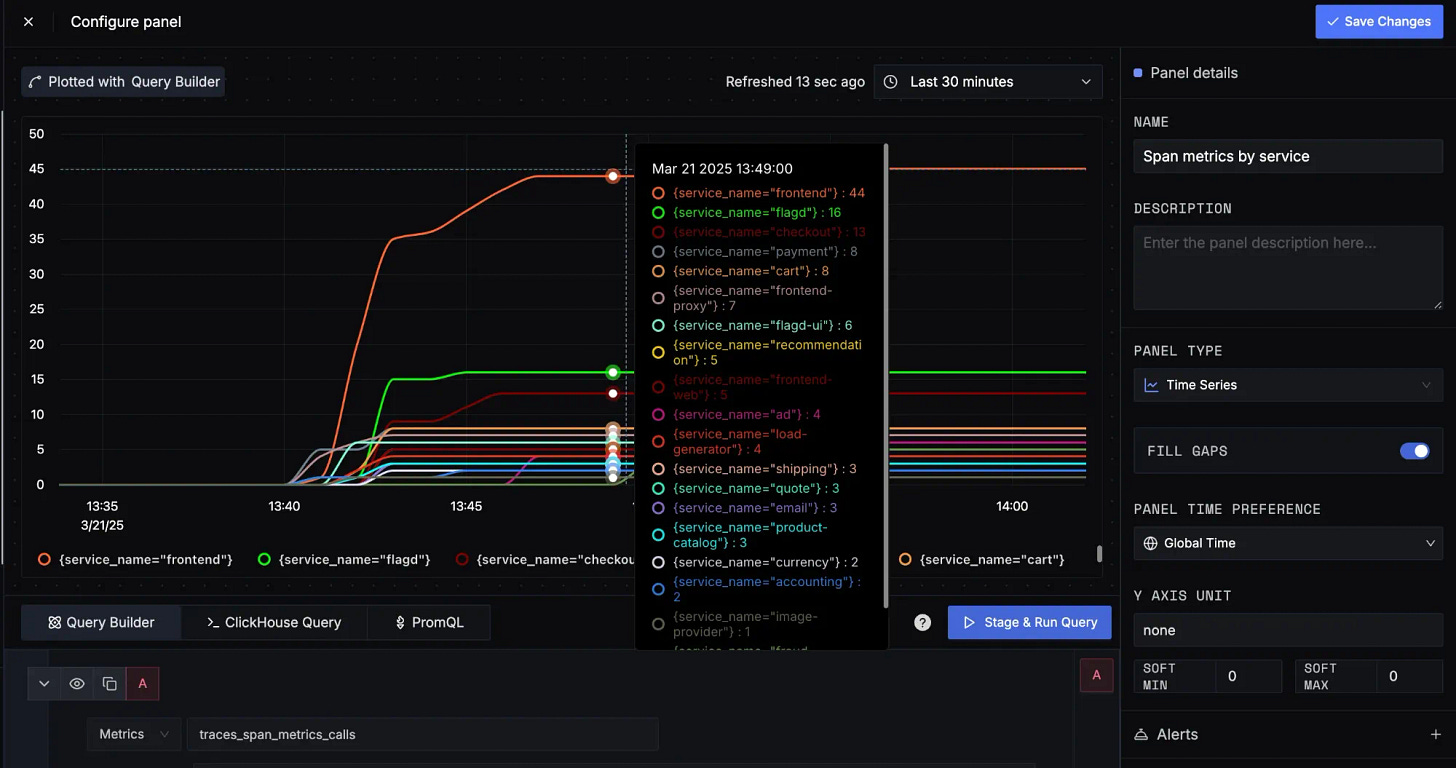
We are using a custom dashboard called Spanmetrics dashboard here, which helps to monitor the trace span calls. You can export the JSON here. Read this to understand in detail about SigNoz dashboards. Also, make sure to enable the productCatalogFailure flag to simulate this. A few minutes after enabling the flag, if you browse to the astronomy shop UI, you can see a lot of red in the network calls.
You’ll also notice that the error rate for several services is starting to creep up, especially for the frontend. [In the Span Metrics dashboard]
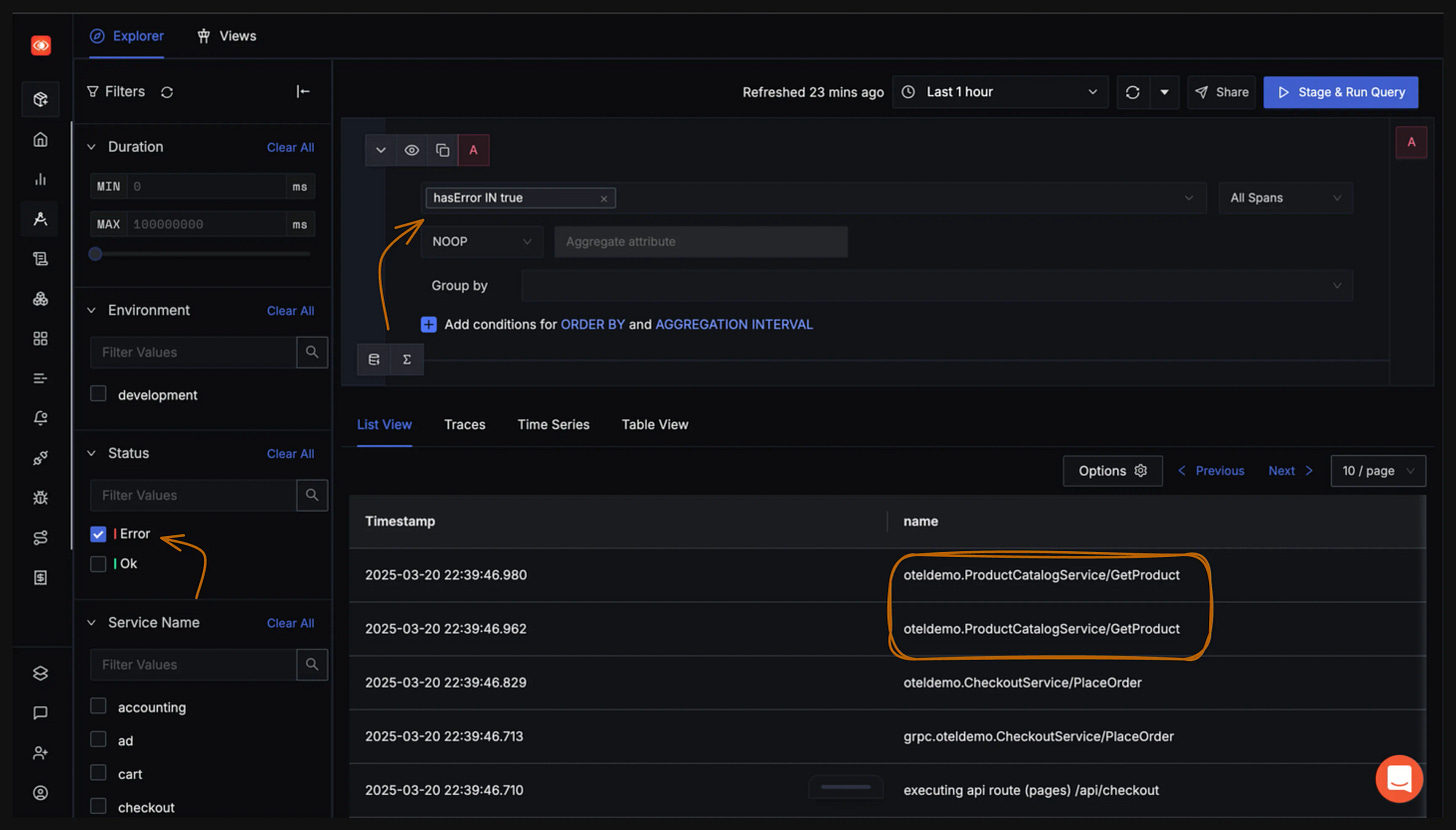
Go to the Traces tab, let’s filter only the ERROR traces. We observe that the filter populates the query builder above as well!
Traces explorer with Error filter applied and subsequent query output
The output indicates that ProductCatalogueService could be a service of interest. If you explore all of the traces that call ProductCatalogService/GetProduct, you may notice that the errors all have something in common: they happen only when the attribute is a specific value.
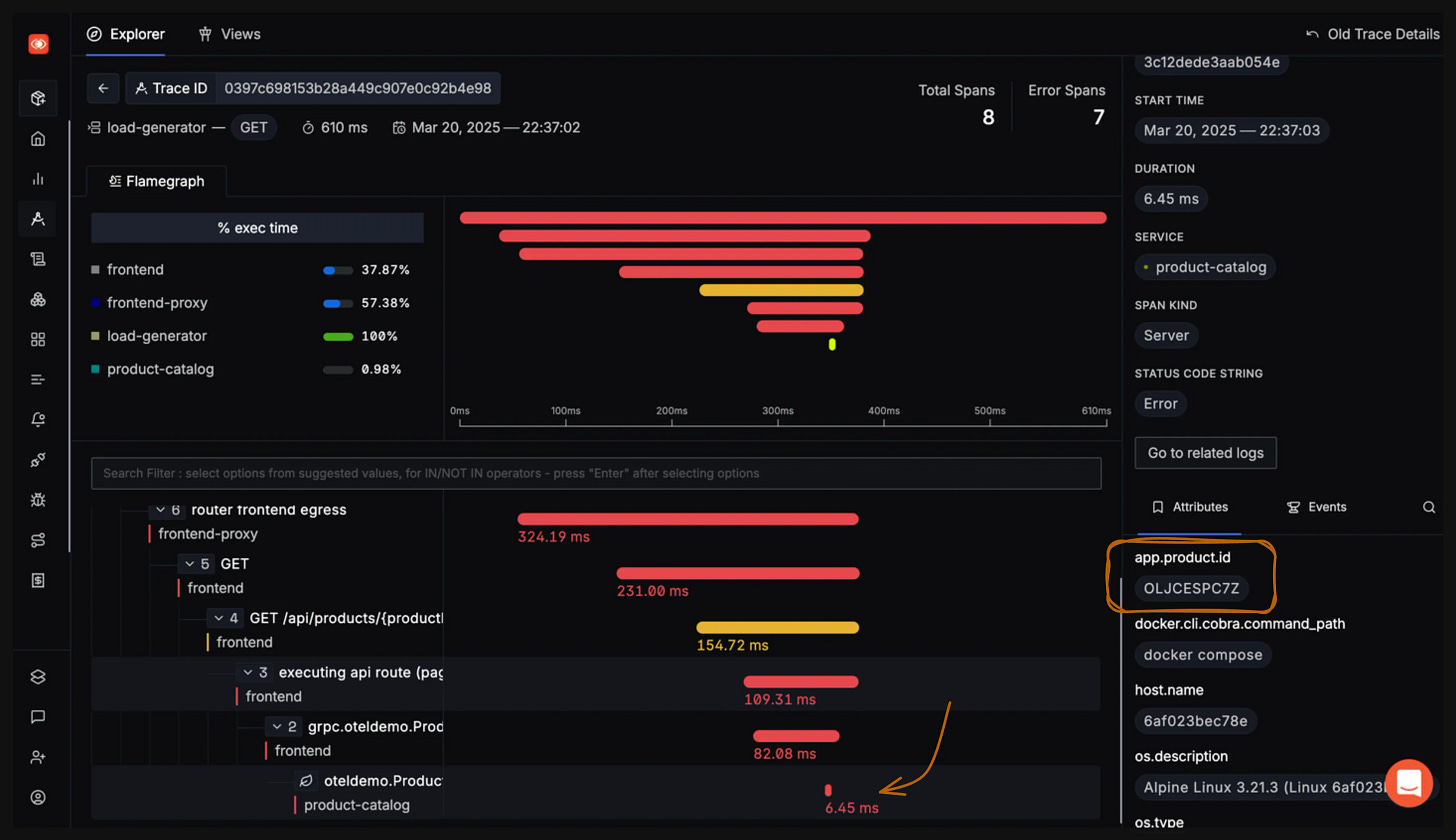
Automatic instrumentation doesn’t know the domain-specific logic and metadata that matter to your service, like product id in this context. You have to add that in yourself by extending the instrumentation. In this case, the productcatalog service uses gRPC instrumentation. OTel Demo App already comes with a useful soft context attached to the spans that it generates, which has been leveraged for this scenario.
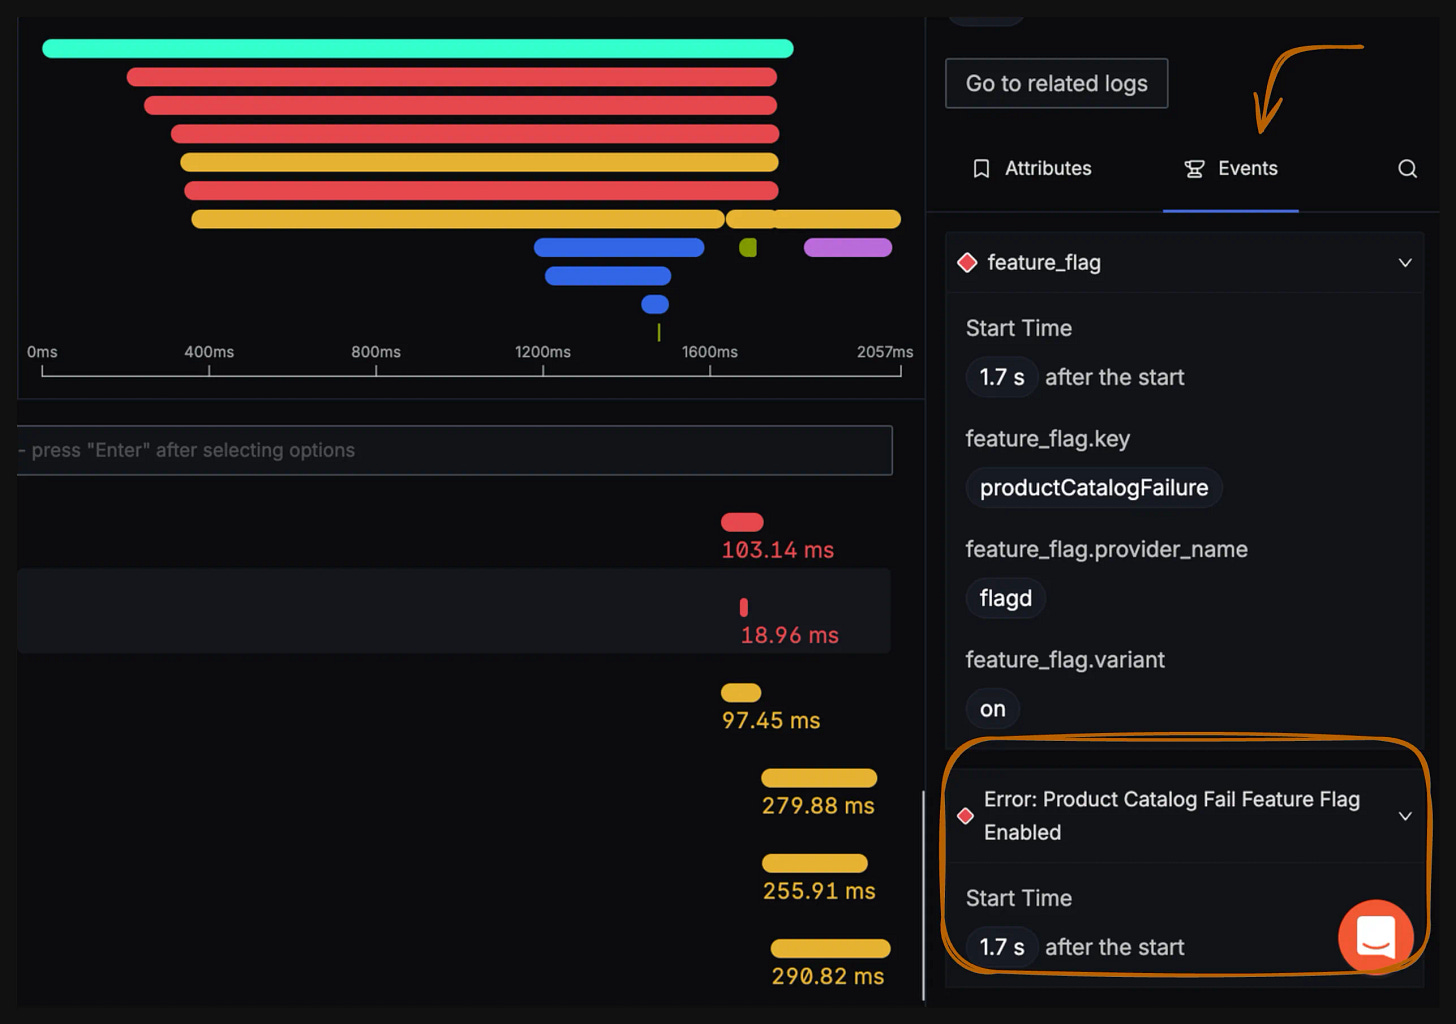
This is indeed a very interesting observation, but it doesn’t point us to the root cause. Let’s check the Events tab for the traces that error out.
This is an aha moment for you! The above snapshot clearly shows that the reason for the error is the productCatalogFailure flag being enabled. If you are a front-end developer, you can breathe.
SigNoz - All in One Open-source Observability Tool
SigNoz gives developers full visibility into their applications with seamless correlation of metrics, logs, and traces on a single, open-source platform. We have listed down all the features which makes SigNoz very powerful:
Traces Explorer: Powerful trace explorer to drill down into requests, analyze spans, and debug performance bottlenecks.
Exceptions Tab: Automatically captures exceptions and errors from your applications to help identify failure points quickly.
Messaging Queue Visibility: Gain deep observability into asynchronous systems like Kafka, RabbitMQ, and more with support for messaging semantic conventions.
Infrastructure Monitoring: Monitor host-level metrics like CPU, memory, disk, and network usage alongside application telemetry.
Smart Alerts: Define alerts based on static thresholds or use anomaly detection to catch issues early.
Self-Host or Use SigNoz Cloud: Choose between managing your own deployment or using our fully managed cloud.


