How to read distributed traces when you didn’t write the code
As far as observability is concerned, we as engineers are almost always staring at logs, traces, and metrics emitted from parts of the software we haven’t even remotely breathed upon.

💌 Hey there, it’s Elizabeth from SigNoz!
This newsletter is an honest attempt to talk about all things - observability, OpenTelemetry, open-source and the engineering in between! We at SigNoz are a bunch of observability fanatics obsessed with OpenTelemetry and open-source, and we reckon it’s important to share what we know. If this passes your vibe-check, we’d be pleased if you’d subscribe. We’ll make it worth your while.
This blog took 6 days and 5 hours to be curated, so make sure to show some love!
More often than not, we’re fixing a bug we didn’t introduce, working on legacy code we didn’t author, and shipping patches to systems we didn’t break. As far as observability is concerned, we as engineers are almost always staring at logs, traces, and metrics emitted from parts of the software we haven’t even remotely breathed upon.
This is a very real dilemma, and we are attempting to address it here.
Let’s reframe the dilemma a bit and look at it with a new lens. Traces are inherently the most elaborate of the three observability signals. You don’t need to have written the code to read its corresponding trace, because the trace itself acts as documentation written by the system. I believe figuring out issues from reading traces is pretty much a skill, which comes with practise and a little guidance ✨
Let’s break this down further.
Anatomy of a trace
A trace can be considered as a tree of spans. Each span is a unit of work, like an HTTP call, a DB query, or a function execution. The root span acts as the entry point, and the children nest under their parents.
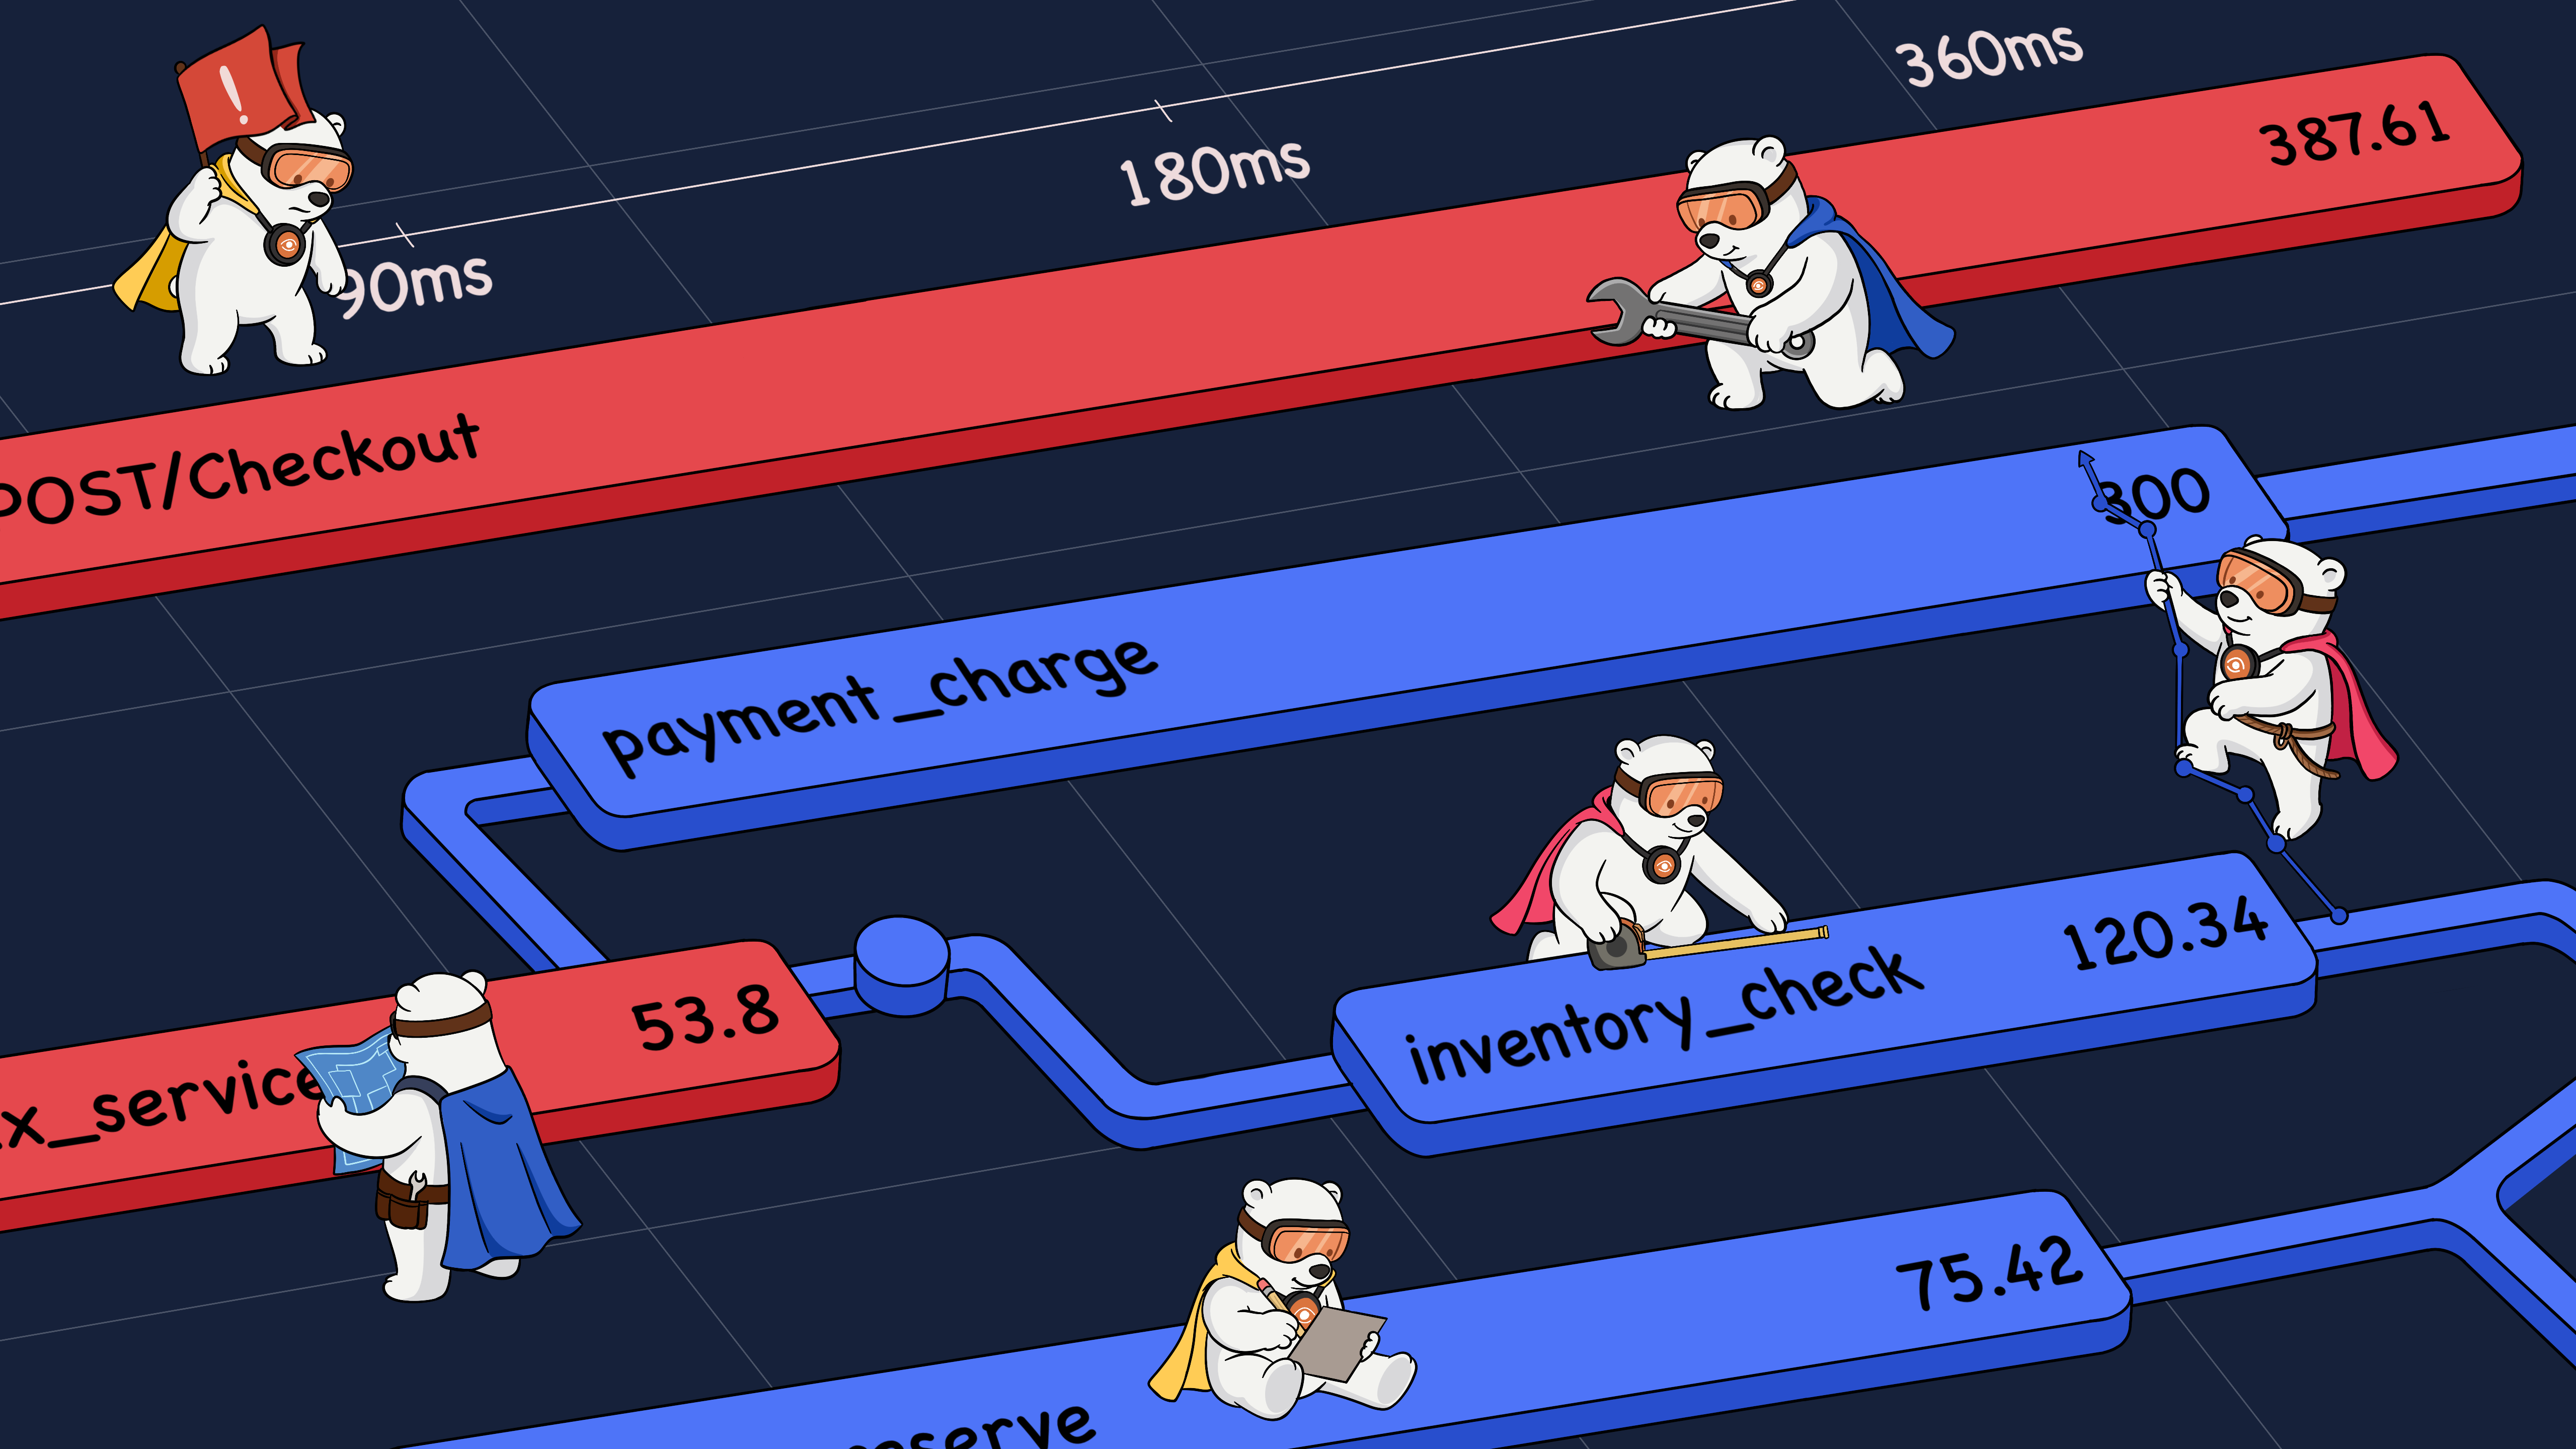
Time flows from left to right, as depicted in the image below.
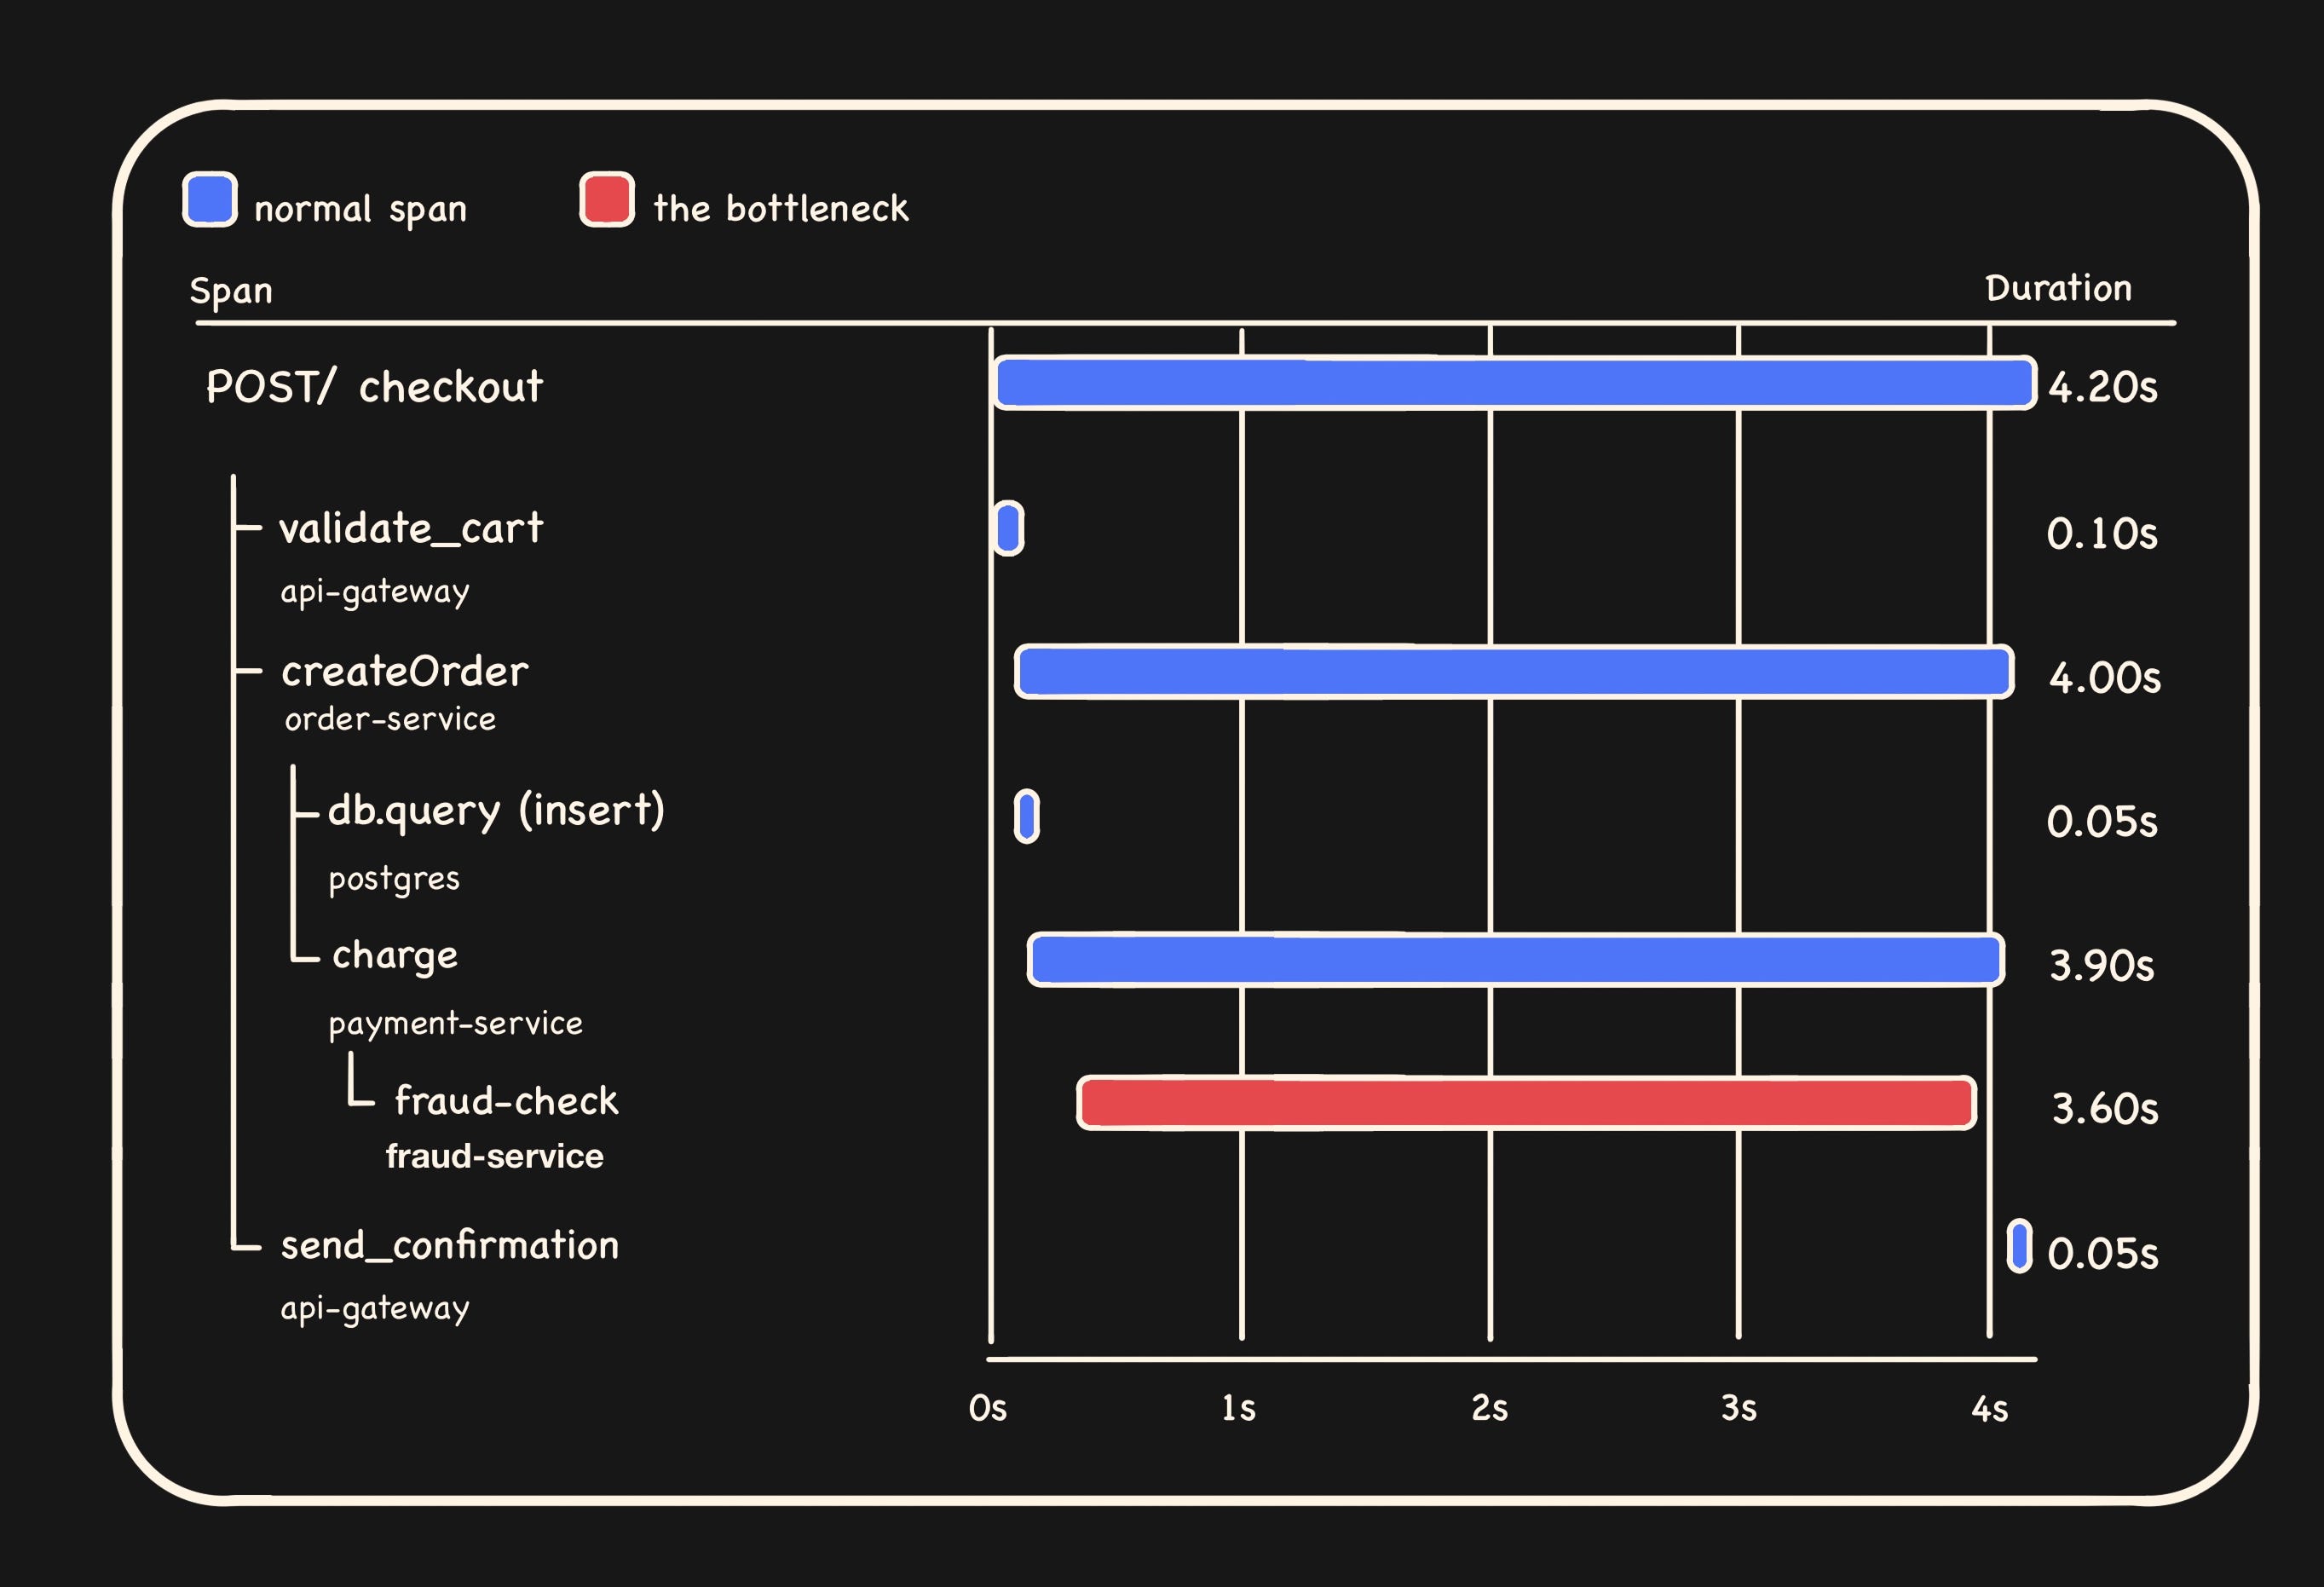
Let’s dissect the above trace. Gateway received a POST /checkout. It validated the cart, called order-service.createOrder, which inserted a row in Postgres and then called payment-service.charge, which made an external fraud-check call. Finally send_confirmation is called by the gateway.
Now, circling back, we realise we haven’t opened a single one of these services but already know the shape of the request.
Flame graphs, service maps, Gantt charts are all essentially just different angles on the same tree.
Each span carries:
A name (
GET /checkout,SELECT users,processCheckout)A service from which it originates from (
api-gateway,payment-service,postgres)A duration
Attributes which are key-value metadata (
http.status_code=500,user.id=42,db.statement=SELECT * FROM ...)Events which are timestamped logs attached to the span, often including stack traces
A status like OK or ERROR
Kudos! Now we can read a stranger’s trace and follow the request end to end, which in itself is a great milestone. But the trace is also a key, and it unlocks more than the waterfall if we get our techniques right.
The kinds of spans you’ll meet
Open any unfamiliar trace, and every span you see falls into roughly one of these buckets. Knowing which kind you’re looking at tells you what to expect from its attributes, which tells you where to look next.
Server spans are entry points into a service, which reads like this service received a request. Their attributes usually include http.route, http.method, http.status_code. These are your bookmarks, and each one means we just crossed a service boundary.
Client spans are outbound calls, which translates to this service calling somebody else. They pair up with server spans on the other side, which is how the trace stitches multiple services together into one waterfall.
Database, cache, and queue spans wrap calls to your data layer. The good ones carry db.statement, db.system, db.operation. If you see a slow DB span, the actual SQL is usually right there in the attributes.
Internal spans are work that happens inside a service including a function call, a computation, a loop. These show up when someone manually instrumented a chunk of code they cared about. You can treat them as breadcrumbs left by past engineers, marked because they thought they mattered and could help steer you in the right direction during a crisis.
A method for reading
There’s no hard-and-fast rule for reading a trace, as I said, it’s a skill that sharpens with practice. But I’ve tried to pin down the rough structure I follow when I’m staring at one. Here are the 4 steps, in order.
1. Find the root. Start at the root span, the very first one that triggered the whole trace. Was it a user hitting an endpoint, OR a scheduled job, OR a queue message? The root tells you that, and its attributes fill in the specifics.
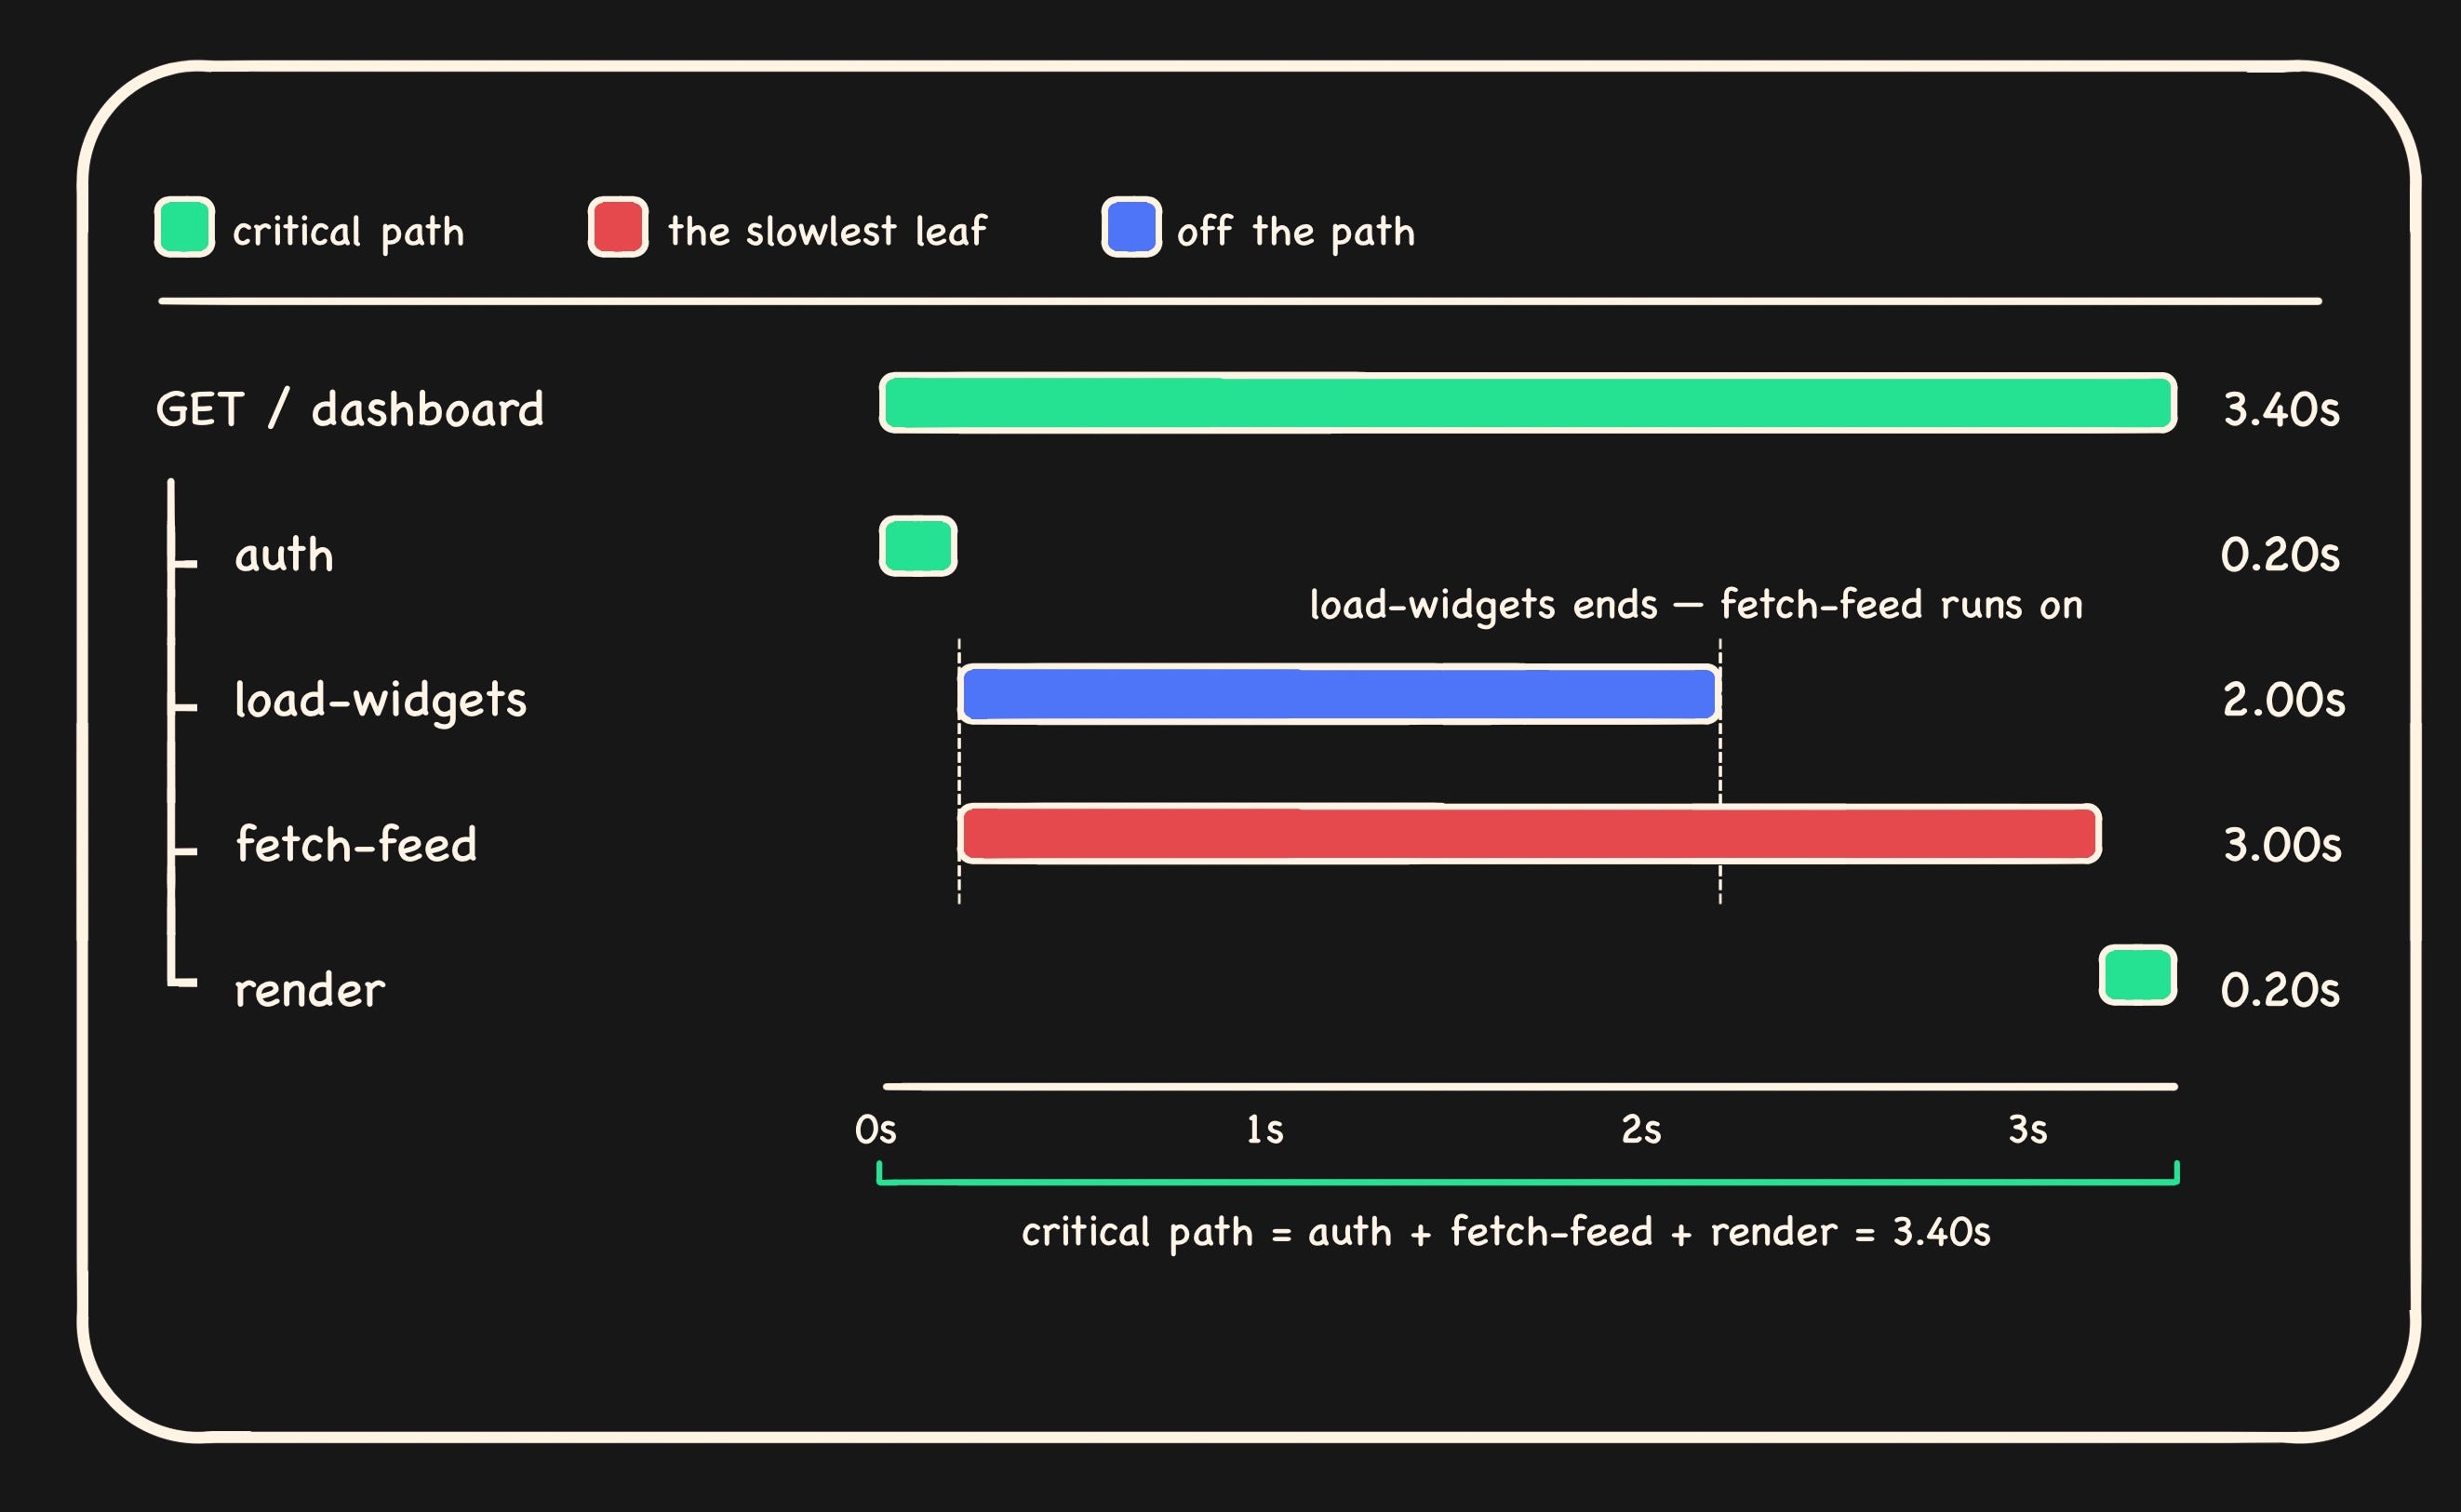
2. Follow the critical path, not the longest span. A 2-second span running in parallel with a 3-second span contributes zero to your latency. The better question to ask is, what is blocking what? The critical path is the chain of dependent operations from the root to the slowest leaf.
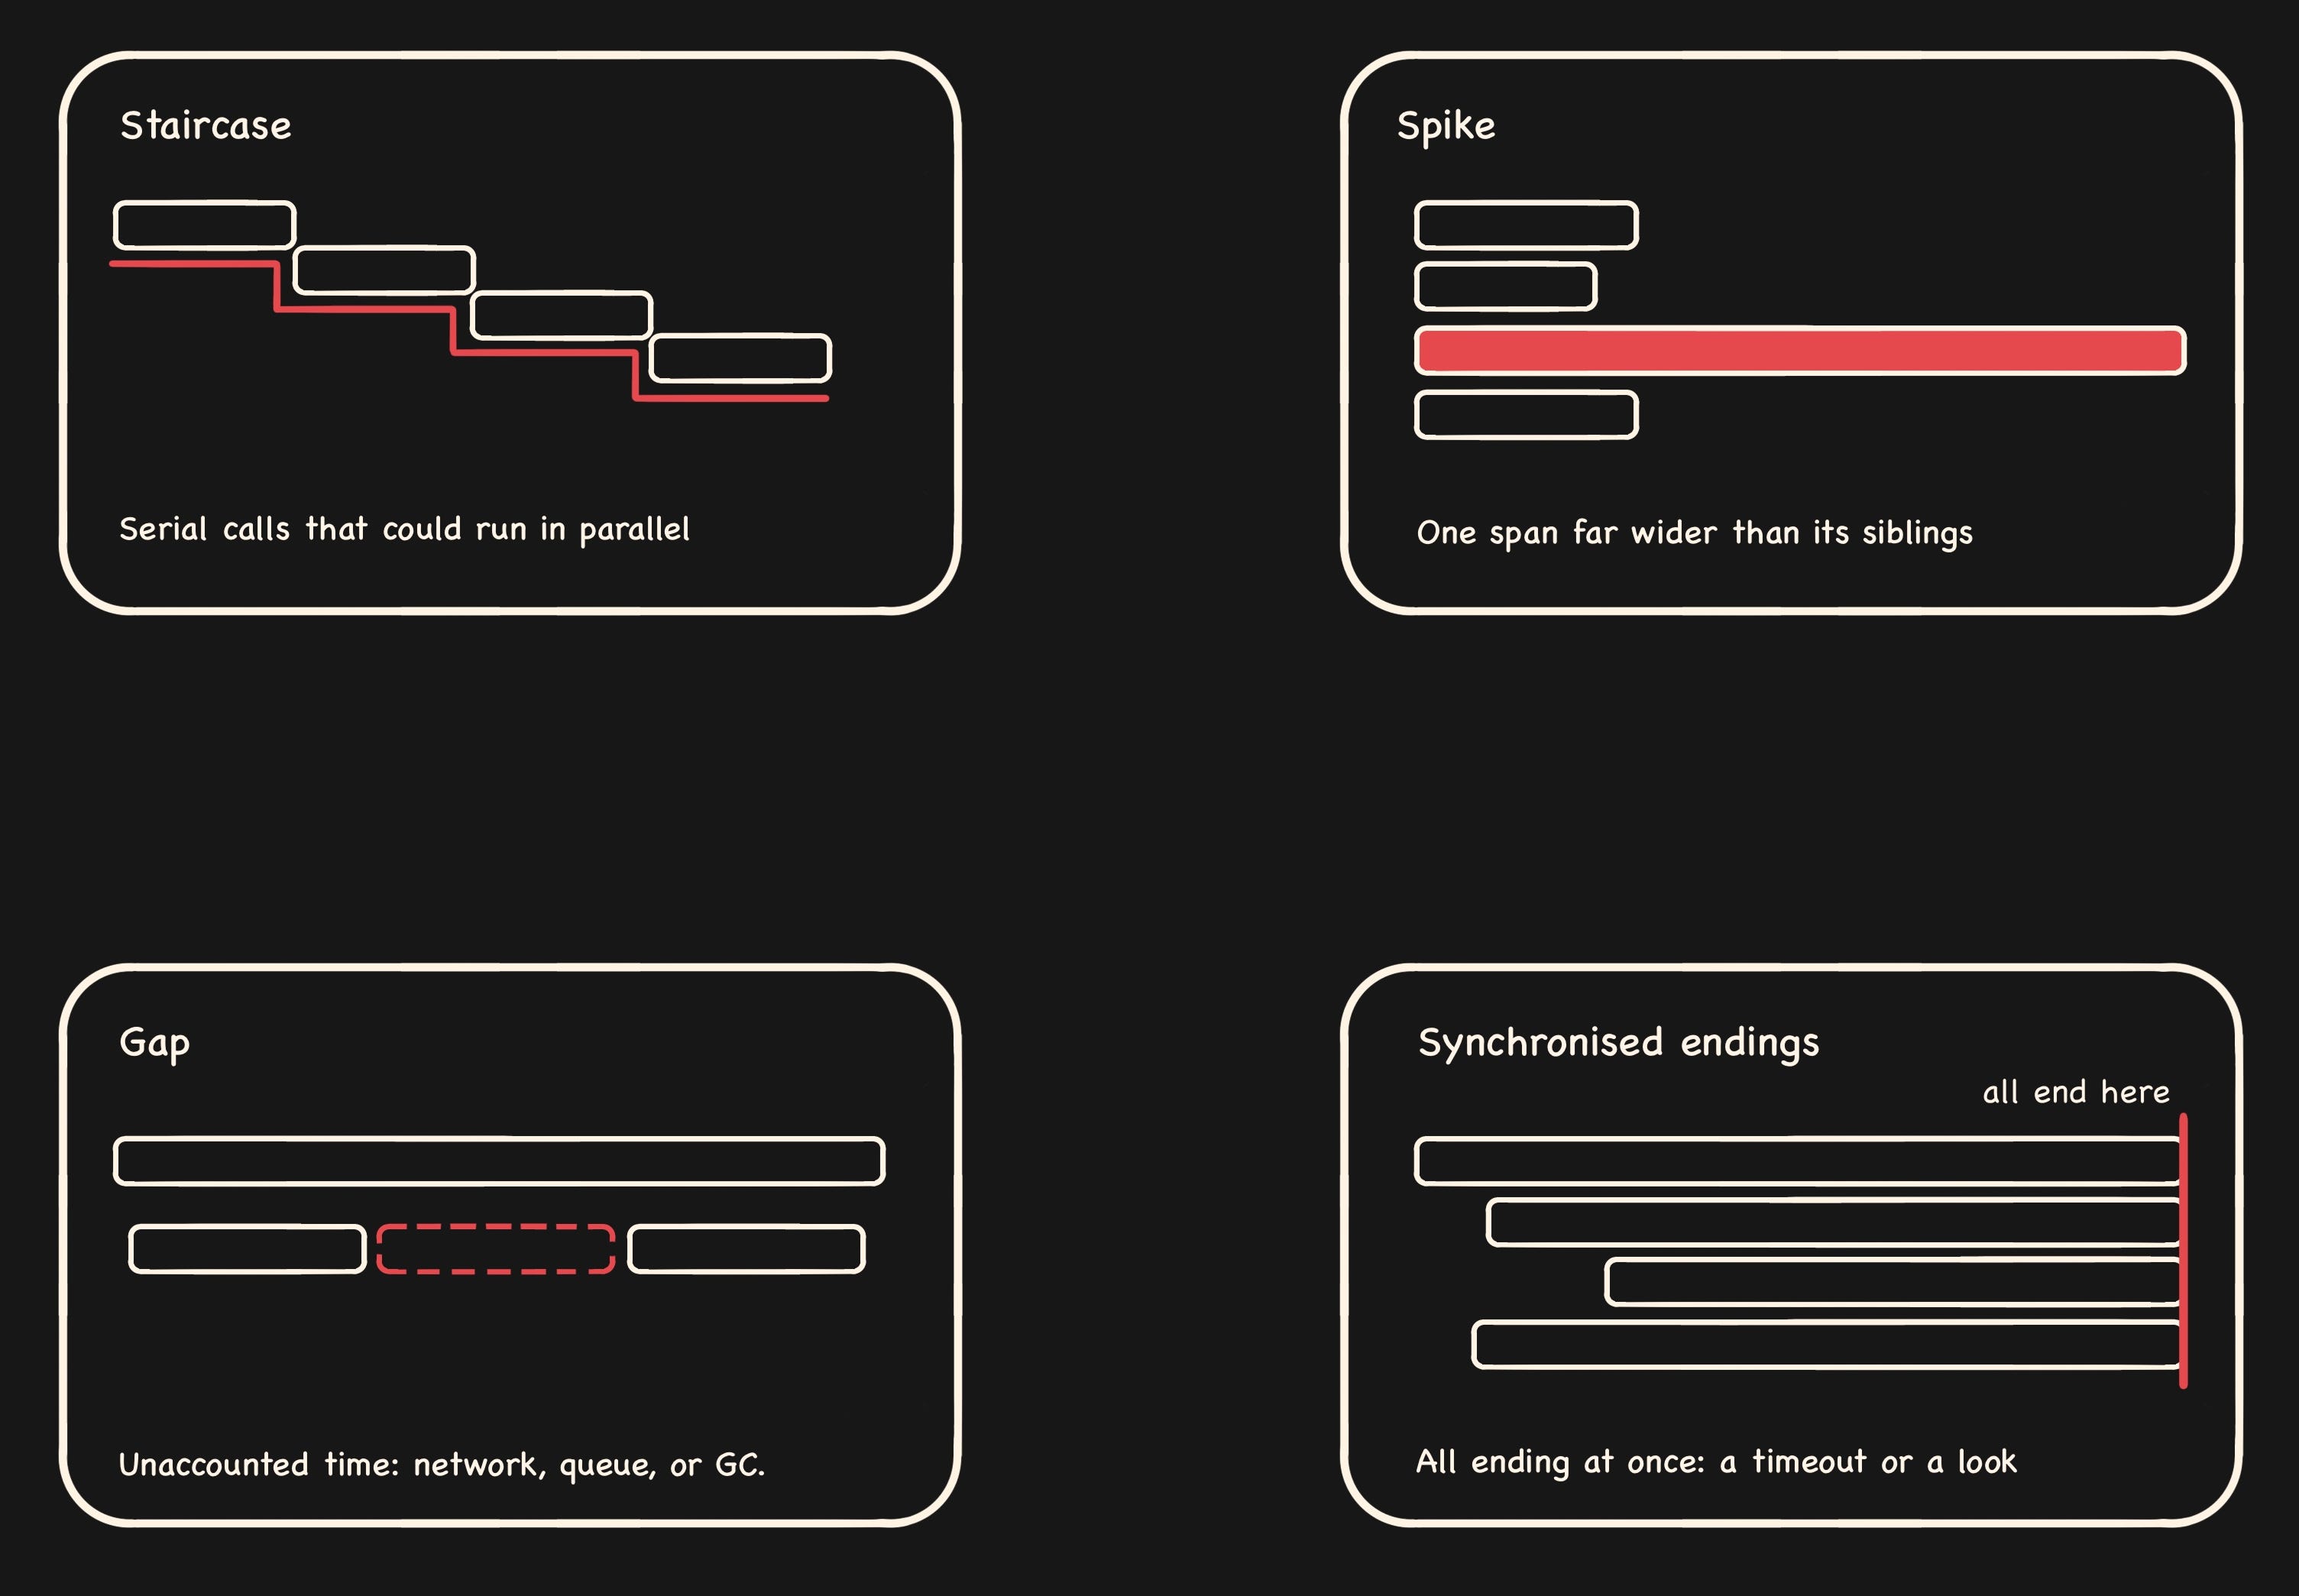
3. Read the shape. Apart from some rare outliers, a few patterns repeat across every trace.
Staircase. This pattern is caused by calls happening one after another when they could’ve just run together. The most common reason is an N+1 query, which occurs when you run one query to fetch a list, then fire off a separate query for every item in it. Fetch 50 blog posts, then loop through, grabbing each author one at a time, and you’ve made 51 queries instead of the 1 or 2 you needed. In a trace, it shows up as a staircase; each little query runs right after the last, so you get a cascade of near-identical spans stepping down the waterfall instead of one clean database span.
Spike. If one span is wider than the ones around it, then nine times out of ten, that’s your culprit.
Gap. Dead time between spans where nothing’s accounted for usually translates to uninstrumented work, network or queue delay, or a GC pause.
Synchronized endings. A bunch of spans all finishing at the same instant is typically either a timeout firing or a lock being released.
4. Read the attributes. Once you’ve found the suspicious span, the answer is often in the attributes. A quick scan through the span attributes should help you locate the culprit easily. For example, db.statement shows the slow query, exception.stacktrace shows the failing line and http.status_code shows the failure mode.
From trace, back to code
The whole point of this exercise is to land in the right file in your editor; let’s circle back to that 😅. Here’s how traces actually get you there:
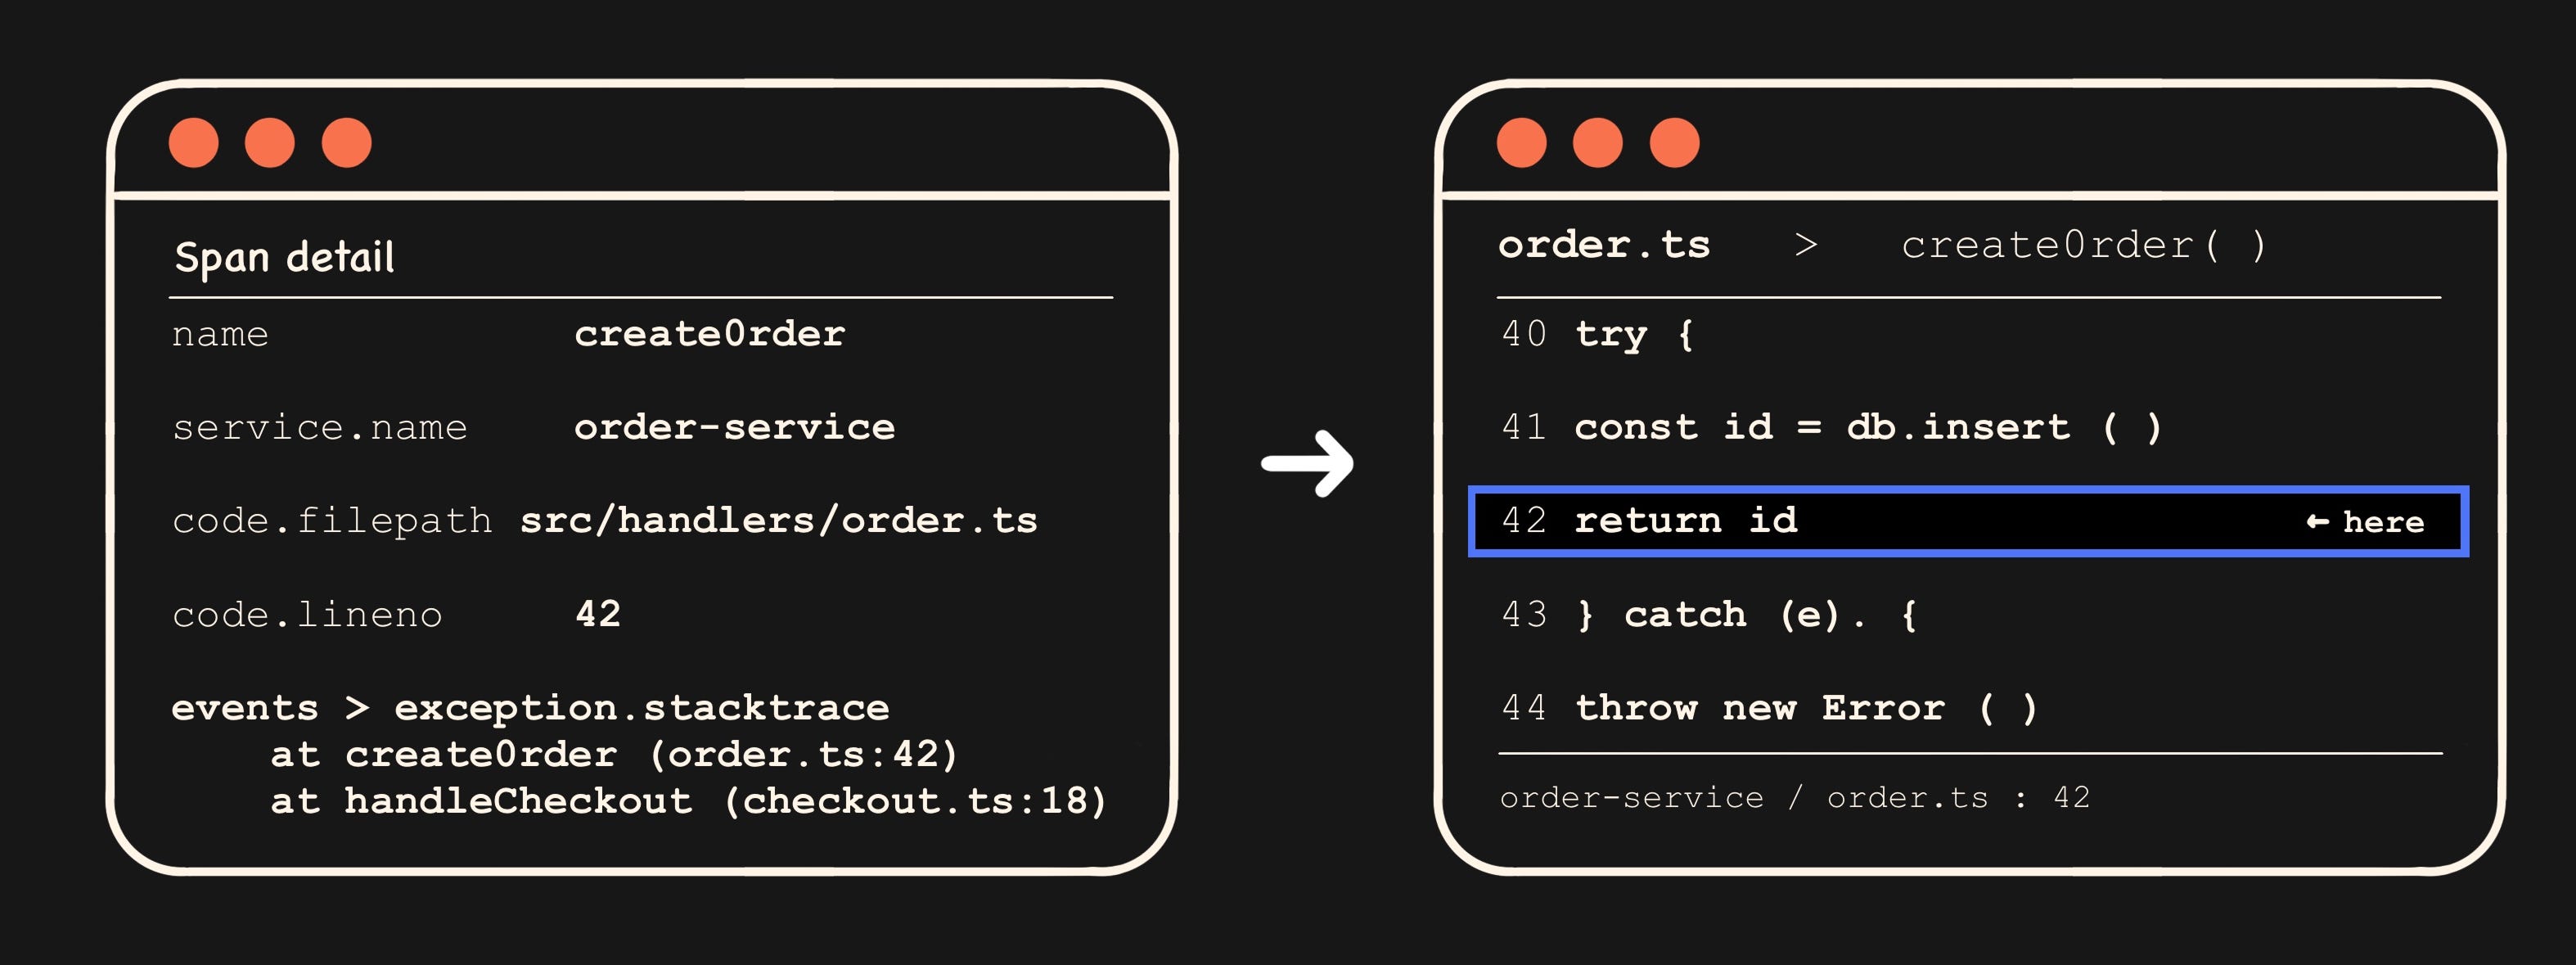
Span names map to functions. If the span is called processCheckout, that’s almost certainly a function name. OpenTelemetry auto-instrumentation often uses the function name directly.
Code attributes, if present, are gold. Spans can carry code.function, code.filepath, and code.lineno. If your instrumentation includes them, you’ve got the file and line number sitting right in the span detail panel.
Stack traces ride on span events. When a span errors, the exception usually shows up as a span event with exception.type, exception.message, and exception.stacktrace.
Service names map to repos. payment-service probably corresponds to a repo or directory. Even when nothing else helps, the service name drastically reduces the search space.
By now, you should have gotten a fair idea of how to locate the corresponding piece of code from the trace.
The meta-point
The skill we’re really talking about is learning a system from its runtime behaviour. And it compounds every trace you read in an unfamiliar service, which teaches you a little more about it. By month three on a new team, you’ll often understand the architecture better than someone who’s only read the code, because traces show you what actually happens in production, contrary to what the code suggests should happen.
So the next time you find yourself staring at a waterfall for code you didn’t write, try reading the trace and listening to the story it’s trying to tell you.
If only I could hire you🙂