How to Reduce Telemetry Volume by 40% Smartly (Java)
But with great power comes great responsibility.

💌 Hey there, it’s Elizabeth from SigNoz!
This newsletter is an honest attempt to talk about all things - observability, OpenTelemetry, open-source and the engineering in between! We at SigNoz are a bunch of observability fanatics obsessed with OpenTelemetry and open-source, and we reckon it’s important to share what we know. If this passes your vibe-check, we’d be pleased if you’d subscribe. We’ll make it worth your while.
This post took 5 days, 11 hours to be curated, so make sure to show some love!
OpenTelemetry has become the de facto choice for many organisations’ observability needs today. And with it, auto-instrumentation has turned out to be a powerful means to implement the same.
But with great power comes great responsibility.

While auto-instrumentation provides a strong baseline, its out-of-the-box (or magical?) nature often produces a telemetry surplus and is a double-edged sword. Because auto-instrumentation is designed to be comprehensive by default, it captures everything in case you need it. Without intentional refinement, this can dilute your signal-to-noise ratio, leading to the generation of surplus telemetry that can inflate storage costs while burying actionable insights under a heap of low-value signals.
While certain types of telemetry surplus are tied to specific libraries, such as HTTP or gRPC, most telemetry waste is a byproduct of the language runtime itself. To illustrate this, we will use Java in the context of the blog. That said, the lessons presented here aren’t isolated; the signals we’ll uncover are often common patterns across the broader landscape of modern frameworks.
This blog is an attempt to help you sieve out the diamonds (good telemetry) from the rocks (noisy telemetry)!
Java Agent for Auto-instrumentation
By simply attaching a Java agent at runtime, developers can capture traces, metrics, and logs without modifying a single line of application code. The Java agent runs in the same Java Virtual Machine (JVM) as the application, using bytecode manipulation libraries such as ByteBuddy to rewrite classes as they are loaded.
The Java agent automatically hooks into common frameworks such as Spring Boot, Tomcat, and JDBC drivers to inject span creation and context propagation logic. While effective, this process, as mentioned before, can result in the generation of not-so-useful telemetry data that can later bog down storage and cause issues.
Let’s discuss them in greater detail.
The Defaults You Should Know About (and Might Want to Disable)
I’ve curated a list of commonly seen (and publicly complained of) not-so-useful telemetry data, referred to as telemetry surplus. Let me introduce them one by one.
#1. URL Path and target attributes
— not specific to Java
Another commonly missed issue is that auto-instrumentation for HTTP clients and servers often captures the full http.url or http.target attribute. If an application uses RESTful paths with unique IDs like /api/users/12345, every unique ID creates a new attribute value.
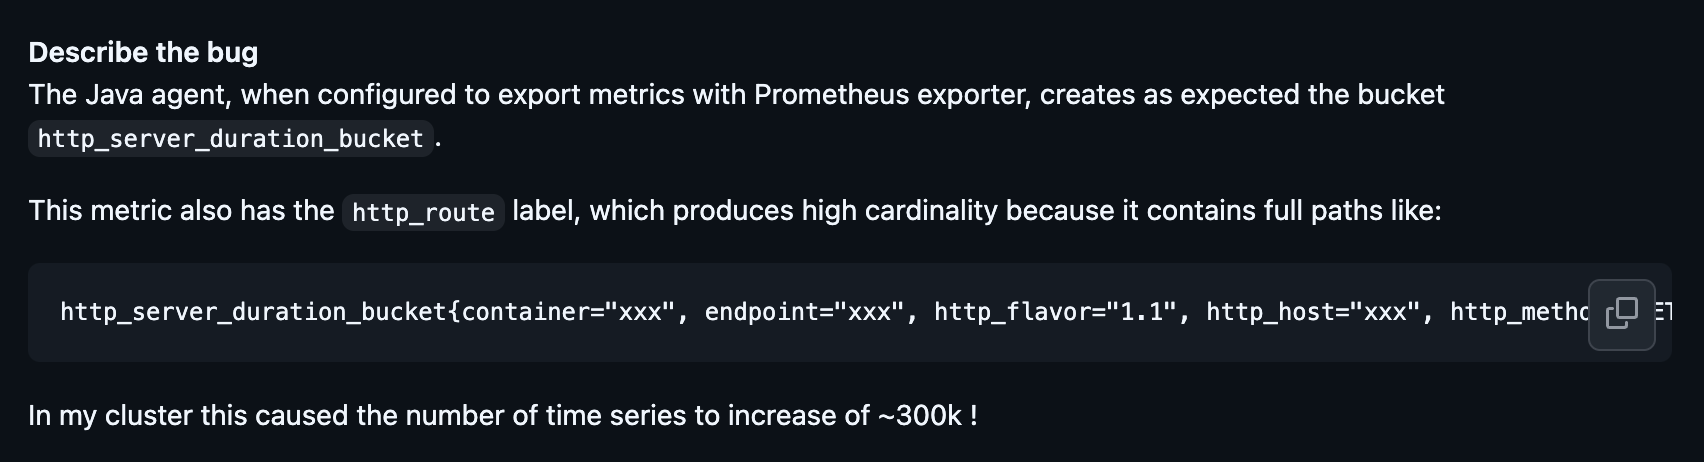
This can be considered a waste because it prevents effective aggregation. Aggregation works by grouping similar data into the same bucket based on shared attributes. Hence, if we use a templated route like /api/users/:id, the system puts every ‘Get User’ request into a single bucket thereby letting you accurately calculate the p99 latency for the entire ‘Get User’ feature.
Hence, make a mental note to always use templated http.route rather than the raw path, which can result in millions of useless data points, aka wasteful telemetry.
#2. Controller spans
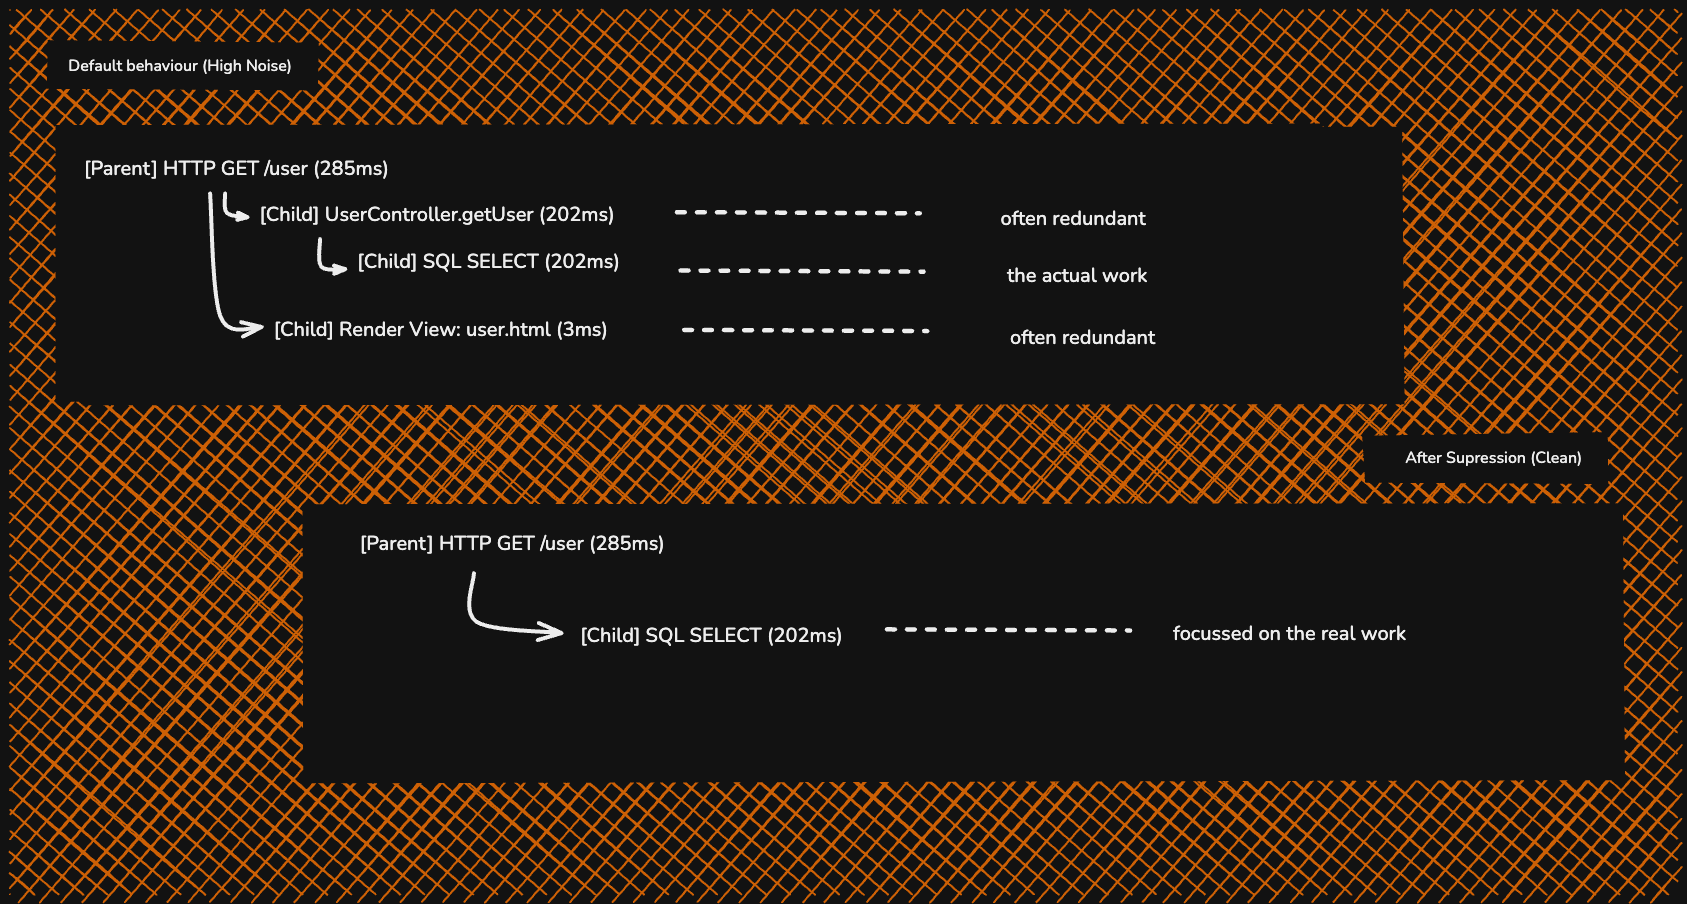
In frameworks like Spring MVC, auto-instrumentation by default creates multiple spans for a single web request. Some types of spans are,
Server Span (
SpanKind.Server): The parent span. It tracks the entire process, from when the request reaches your server to when the user receives a response.Controller Span (
SpanKind.Internal): A child span. It tracks only the time spent inside your@Controllermethod.View Span (
SpanKind.Internal): Another child span. It tracks how long it took to turn your data into a JavaServer Page (JSP).
The obvious catch is that in modern micro-services, controllers are often very thin, and they just immediately call a Service or a Database. If your database call is already being tracked, having a separate span that says the controller took 2ms adds very little value. That is, for most cases, you might not need spans that capture controller and/or view execution.
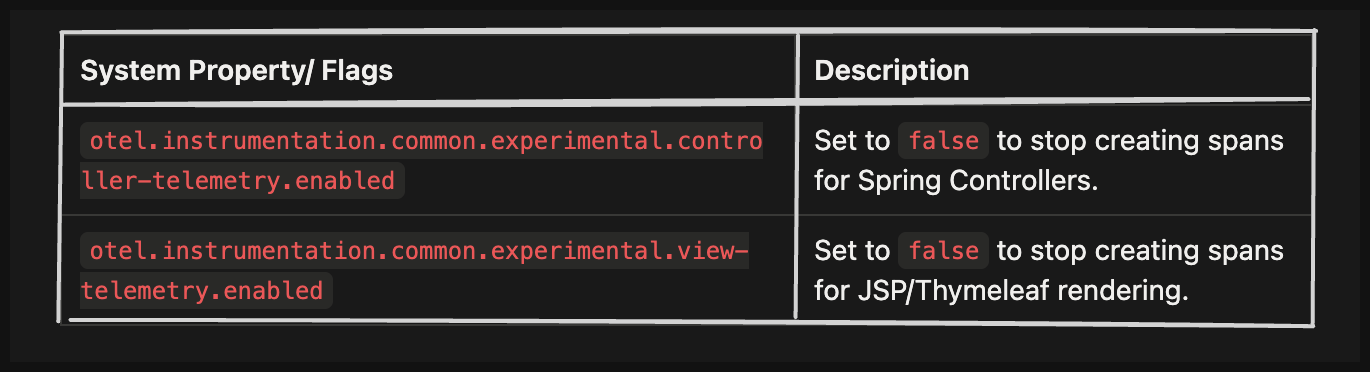
The good news is that you can effectively suppress the generation of these spans by using experimental flags. Here are some flags that let you achieve the desired effect, as mentioned in OpenTelemetry documentation.
#3. Thread name in run-time telemetry
A major source of high-cardinality data occurs in Java runtime metrics, like jvm.network.io or jvm.memory.allocation. Versions 2.10.0, 2.11.0, and 2.13.1 of the agent included the thread.name attribute by default in these metrics. In environments that use large thread pools or virtual threads, this creates an unbounded number of unique time series, potentially leading to a cardinality explosion.
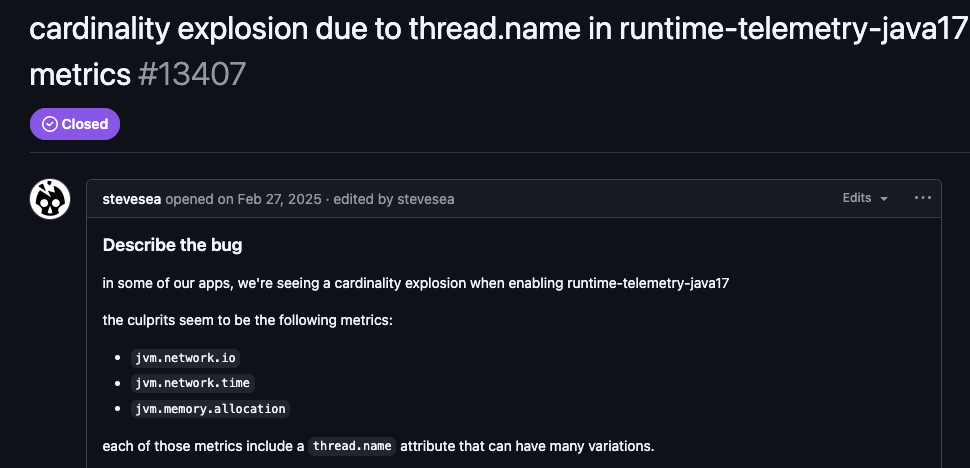
This issue was later corrected; maintainers removed the attribute from default metrics starting with version 2.18.0 (via PR #14061). So, if you are using a previous version make sure you have set proper guardrails or bump up to a later version.
#4. Duplicate Library Instrumentation
This is an interesting dilemma.
Let’s first dissect the problem at hand. So, usually Java agents automatically attach to every supported library they find in our class path (of the application/ project) and end up instrumenting multiple layers of the same outgoing request.
Let me break this down with an example.
In modern Java development, we rarely use a low-level library directly. Instead, we use high-level SDKs. For example:
Application Code calls the AWS SDK to upload a file to S3.
The AWS SDK (high-level) uses Apache HttpClient (mid-level) to execute the request.
Apache HttpClient uses Java Networking (low-level) to send bytes over the wire.
Now, the Java Agent would see all three layers and create three separate spans for the same single logical operation. This results in nested spans that describe the same work, effectively doubling or tripling the telemetry volume for every outbound call.
To prevent this, the OpenTelemetry Java Agent suggests using a Span Suppression Strategy. This logic detects when an instrumentation point is already wrapped by another instrumentation point higher up the call stack.
The behaviour is controlled by the following property: otel.instrumentation.experimental.span-suppression-strategy
There are three primary strategies used to decide which spans to keep and which to discard. You can read more about that here.
#5. Resource attributes
Auto-instrumentation detectors for Kubernetes and host metrics often capture dynamic, unique identifiers by default, such as container.id, k8s.pod.uid, or process.pid. When these are attached to metrics (specifically), they create a new time series for every single container restart or process launch. This tampers with aggregation, and the metrics database is flooded with thousands of dead time series, increasing storage costs and significantly slowing down query performance for long-term trends, adding to telemetry surplus.
#6. JDBC and Kafka Internal Signals
Certain auto-instrumentation modules are inherently chatty, generating high-frequency spans for internal mechanics that carry little diagnostic value.
For example, the jdbc-datasource module (now often disabled by default) creates a span every time a connection is retrieved from a pool via getConnection(), resulting in thousands of entries that merely confirm the pool is functional.
Similarly, Kafka instrumentation can produce excessive spans for background heartbeats and metadata checks.
To mitigate this noise, these specific modules can be disabled upstream by setting -Dotel.instrumentation.jdbc-datasource.enabled=false or -Dotel.instrumentation.kafka.enabled=false, OR filtered downstream in the Collector to drop specific span names like poll or heartbeat, depending on the greater architecture of your application.
#7. Scheduler and Periodic Jobs
— can be broadly applied to schedulers and jobs in different languages
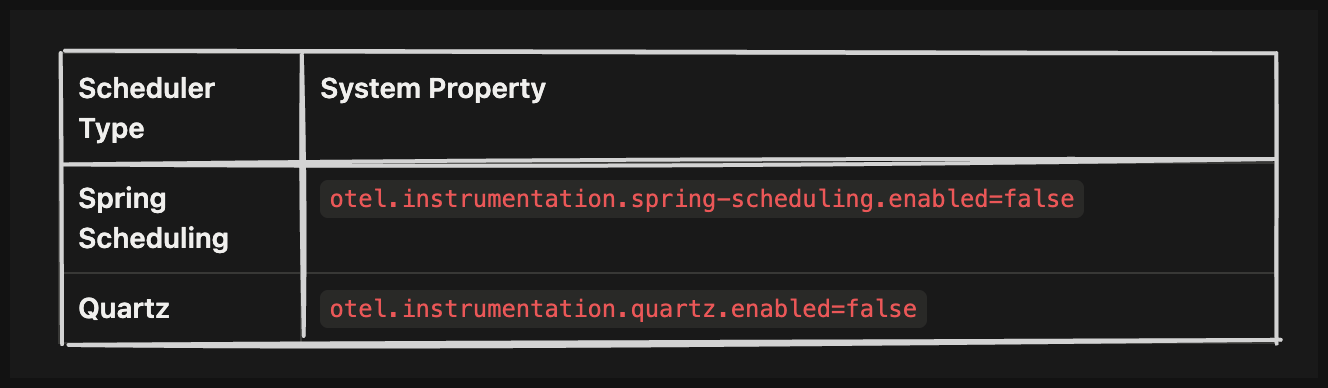
Applications using Spring Scheduling or Quartz for background tasks like polling a database or checking a cache every second generate a span for every single execution. If a job runs once per second but does nothing interesting 99% of the time, it creates 86,400 successful but meaningless spans per day. This qualifies as telemetry waste in most cases.
You can disable the generation of these scheduler spans by using the system properties listed below.
#8. SDK Misalignment
Another massive source of enterprise surplus occurs when a framework like Trino initialises its own internal OpenTelemetry SDK instance instead of joining the global instance provided by the Java agent.
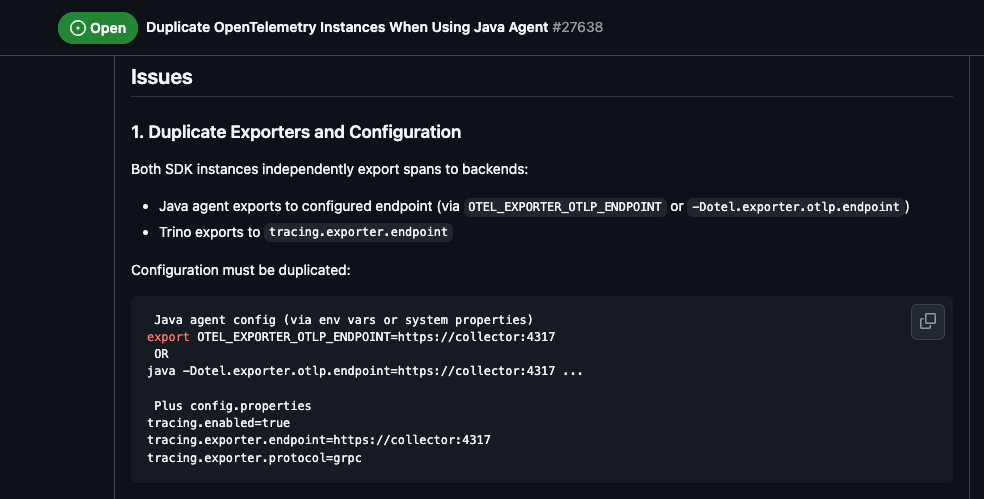
This results in two parallel telemetry pipelines running in one JVM, doubling memory overhead and network traffic. Because the instances are separate, the valuable business spans from the framework, which often misses the agent’s auto-detected resource attributes like Kubernetes namespace, making the data invisible to standard production queries and hence becomes telemetry surplus.
Mitigation Strategies 🚒
Now that we have seen several ways your application could generate telemetry, this section provides a broad overview of how you can mitigate the resulting waste. As they say, prevention is better than cure; generating less telemetry surplus is the best way to eliminate it, but in most cases, it’s almost inevitable, and it’s important to learn how to mitigate it.
Mitigating telemetry waste requires a smart combination of upstream prevention and downstream pruning. For upstream, the most effective defence is selective enablement. By disabling the default capture everything behaviour and re-enabling only critical modules, while specifically suppressing known chatty modules or experimental controller spans as mentioned in the sections above. Downstream, where the telemetry meets the collector, it serves as a powerful filter using the processor to delete redundant resource keys and employing tail sampling to keep 100% of error traces, while sampling only a tiny fraction of successful, low-signal traffic can reduce data volume without sacrificing diagnostic efficacy.
Really useful stuff as ever, keep it coming!
Excellent analysis! This articualtes the issue of telemetry surplus from auto-instrumentation and diluted signal-to-noise ratio perfectly.