How We Achieved 30% Faster Log Queries by Overcoming ClickHouse's Native JSON Limits
What started as an investigation into filtering inconsistent dot-key notation in JSON logs ended up optimising our query performance by 30%.
💌 Hey there, it’s Elizabeth from SigNoz!
This newsletter is an honest attempt to talk about all things - observability, OpenTelemetry, open-source and the engineering in between! We at SigNoz are a bunch of observability fanatics obsessed with OpenTelemetry and open-source, and we reckon it’s important to share what we know. If this passes your vibe-check, we’d be pleased if you’d subscribe. We’ll make it worth your while.
This piece is written by Piysuh, Software Engineer at SigNoz, who was also one of the key contributors for making this engineering overhaul happen.
Cheers.
Customer logs data is always messy.
Being (and building!) an observability platform, we get to see all the beautiful, creative ways it can be messy, every single day. And yet, our customers expect, quite fairly, I might add, perfect query results and peak performance.
SigNoz is an open-source observability platform that can be your one-stop solution for logs, metrics and traces. Using ClickHouse as a single datastore and built to support OpenTelemetry natively, SigNoz can help you troubleshoot issues faster with powerful querying capabilities on your observability data.
We recently overhauled how we store JSON logs in ClickHouse [our datastore] to improve query performance and enable filtering of nested dot-notation keys, which was previously not possible. What started as an investigation into filtering inconsistent dot-key notation in JSON logs ended up optimising our query performance by 30%.
In the process, we developed a two-tier JSON storage model that helped us overcome the limitations of ClickHouse’s native JSON data type while paving the way for superior query and aggregation performance for any key in customers’ logs.

How We Used to Store and Query Log Data Earlier
Before this overhaul, we stored the raw log body as a simple string data type. While this was easy to ingest, it created some bottlenecks when developers tried to interact with the data.
Slow Run-Time Parsing and the Impossible GROUP BY
Storing the log body as a string meant the database had no way to instantly look up values inside the JSON whenever a filter is applied to log data.
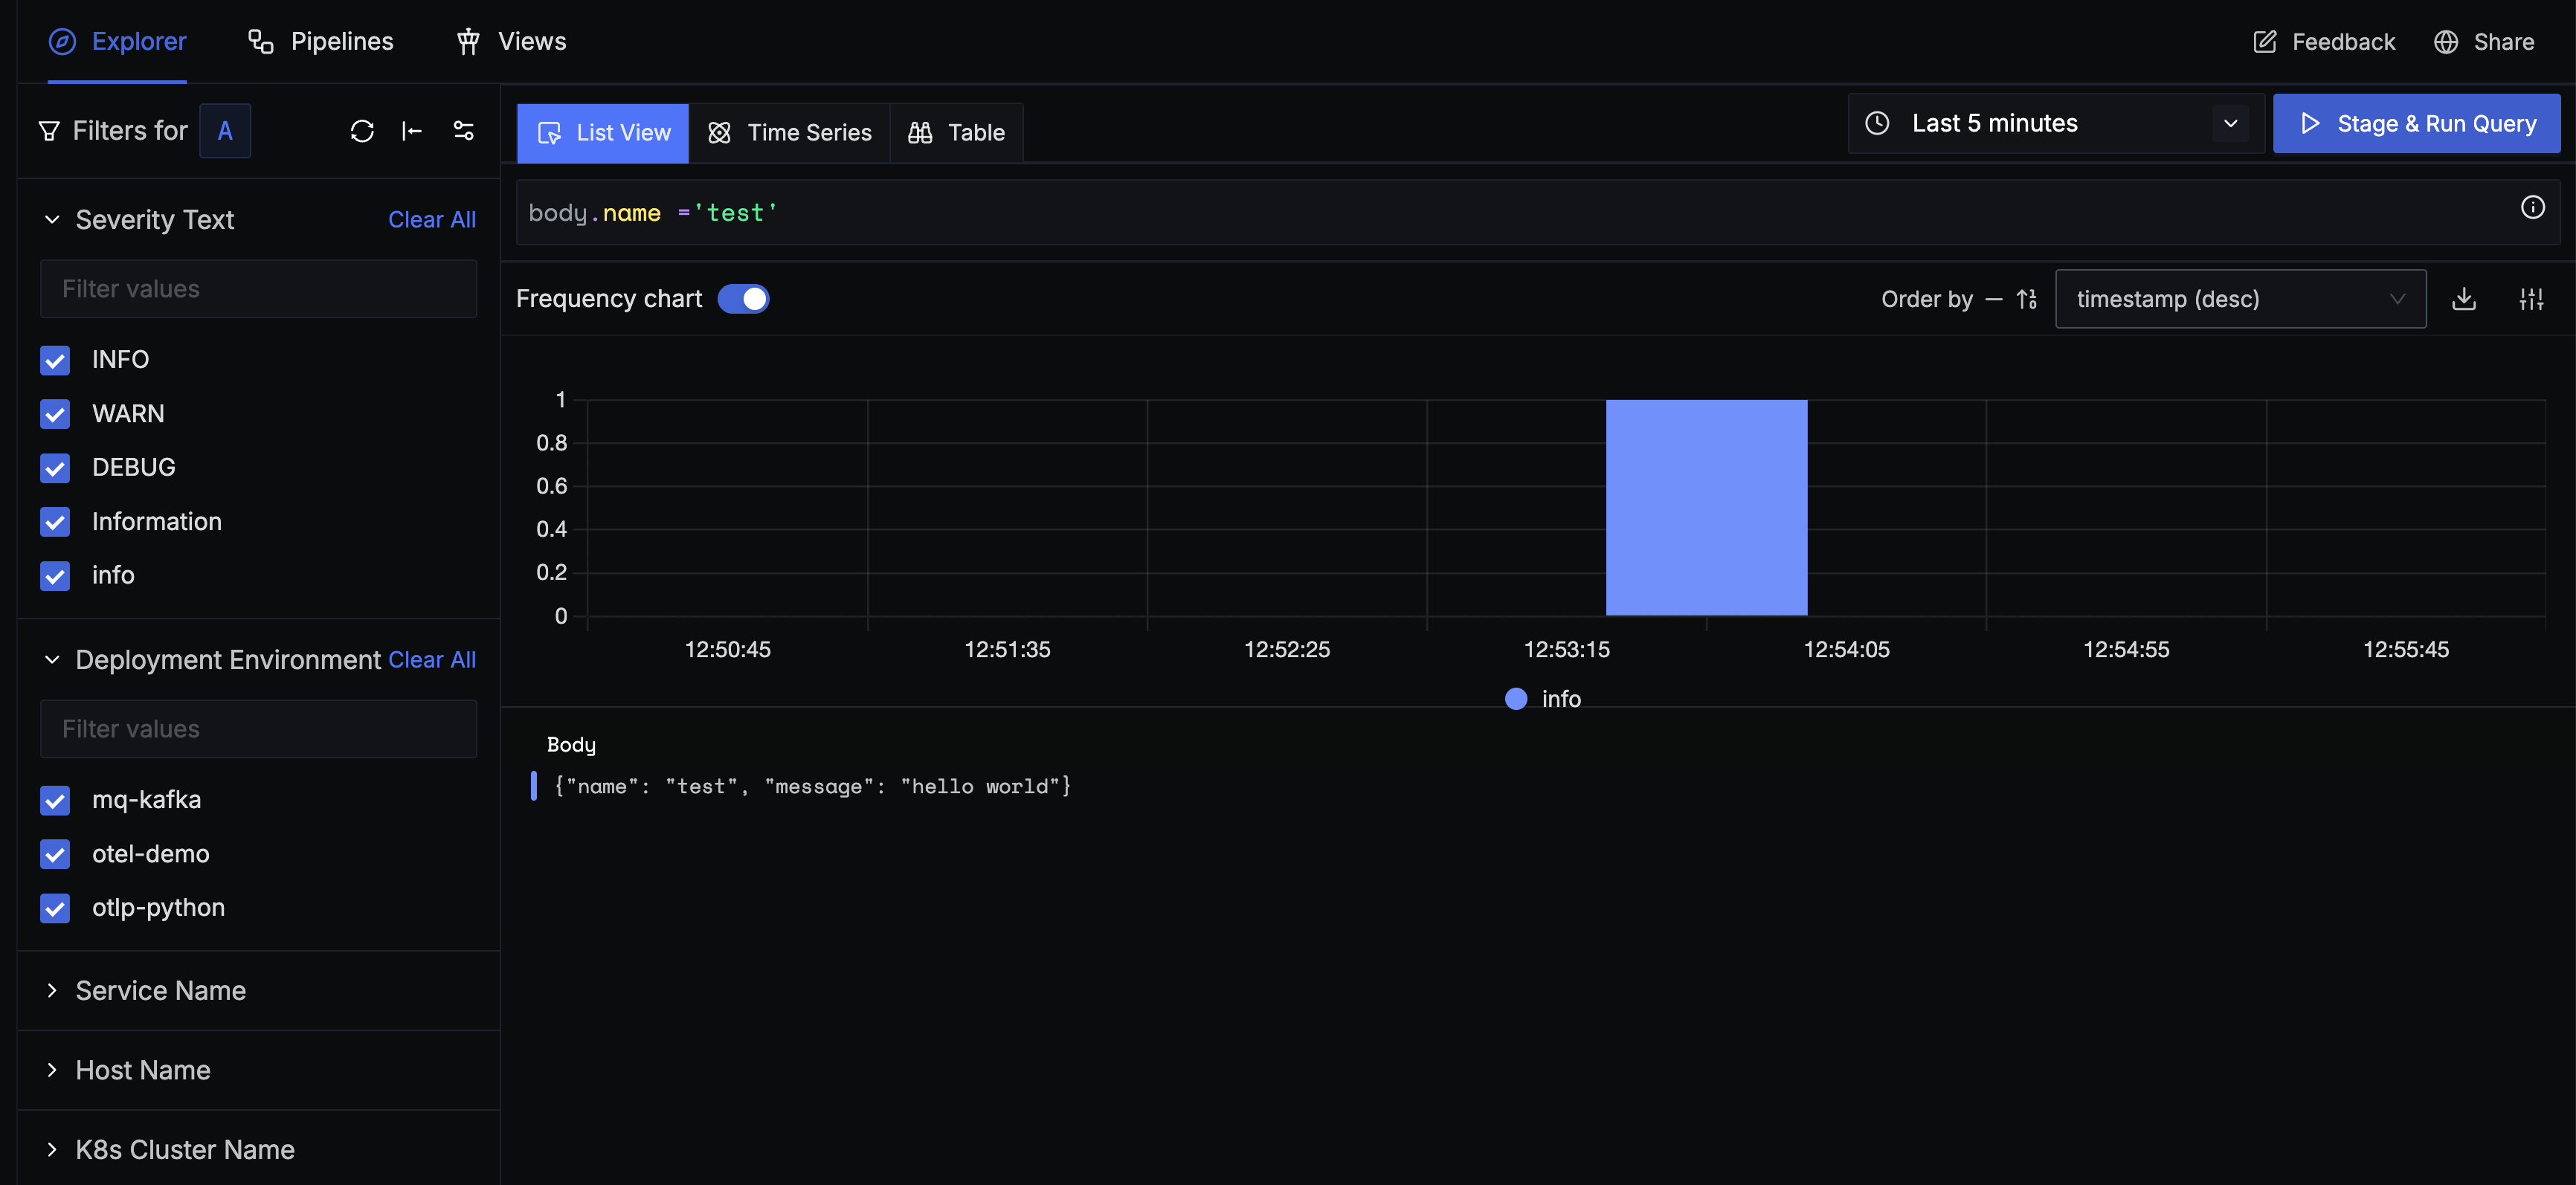
Whenever a user entered a filter query like the one above, the entire log body [stored as a string] is dynamically converted to JSON at runtime. This led to slow query performance, especially when the selected time range was long or there was too much data to scan.
Currently, we address slower query performance with the help of log pipelines. With log pipelines, users can transform their logs to suit their querying and aggregation needs before they are stored in the database.
Though log pipelines are helpful, they are not straightforward. To achieve the necessary performance, users had to manually implement a log pipeline to extract key-value pairs from the JSON string and store the extracted fields as separate attributes.
This is not a seamless out-of-the-box experience for users sending JSON logs.
The Ambiguity of Dot Notation
The final breaking point that spurred our full investigation was the ambiguity created by dot notation. Our query builder could not differentiate between logically different JSON structures when developers used dots for querying:
Scenario 1: Key with Dot in Name:
{
  “user”: {
    “session.id”: “abc-1234”
  }
}
Scenario 2: Nested JSON Structure:
{
  “user”: {
    “session”: {
      “id”: “xyz-5678”
    }
  }
}
Although both of these logs record the same piece of information, it is difficult to differentiate between the two when the user wants to run a query for them. The query needed to find the data in the first example will not work on the data from the second example, and vice versa.
And we needed something that works on both.
This means that when a user performs a search, they might get incomplete results, not realising that some data is being missed simply because of a formatting difference. We can’t expect our users to write separate, complex queries to find both formats or even perform a union to get the necessary data.
This was a really big pain point for us, and the ultimate trigger.
Normalising JSON logs in the Collector
Our first and most direct approach was to solve the problem before the data reached the database. The idea was to intercept incoming logs in our OpenTelemetry collector and transform the JSON structure in-flight.
The proposed solution was to have the collector inspect the keys of every incoming JSON object.
If a key contained a dot, e.g., {”a.b”: “c”}, our code would parse the string, create a nested JSON structure, e.g., {”a”: {”b”: “c}}and replace the original flattened key.
But this involved modifying the actual data the user was sending, and the performance issue was still unresolved. Given these drawbacks, we concluded that modifying the data shape within the OpenTelemetry collector was not a viable path forward.
And at the same time, ClickHouse announced a stable version of the JSON data type.
Using ClickHouse’s native JSON data type
With the introduction of a native JSON data type in ClickHouse, we identified an opportunity to migrate from our string data type column to JSON. Adopting this also meant offloading all associated operations to ClickHouse, allowing us to leverage ClickHouse’s highly optimised, built-in functions for JSON traversal and data extraction.
But there was a limitation. Clickhouse’s native JSON type is built to handle dynamic paths of JSON keys. In order to do so, it needs them to be predictable. But log data from our customers is hardly predictable. It may contain any number of unique paths.
Before understanding how we overcame this limitation, let’s understand more about ClickHouse’s JSON data type.
Inside the Working of ClickHouse JSON Type
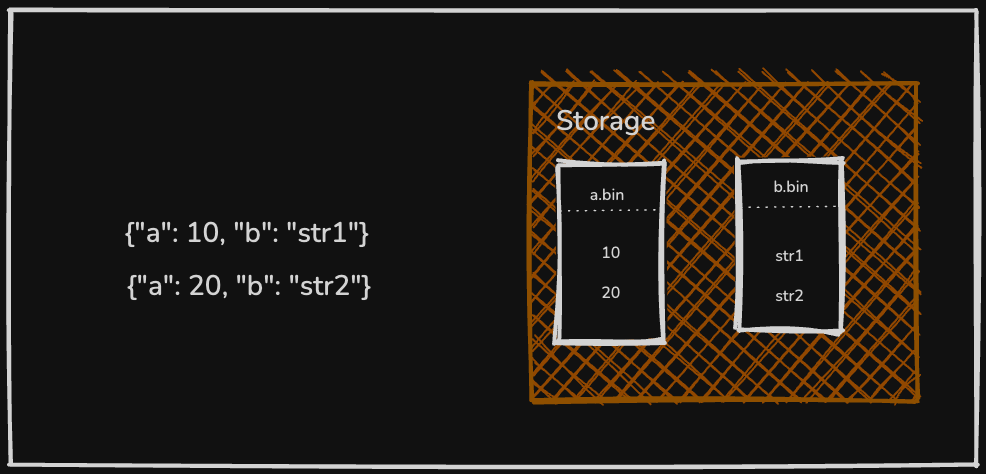
ClickHouse’s JSON data type allows you to store semi-structured JSON documents in a column while preserving efficient, columnar storage for individual JSON fields. Internally, JSON columns flatten nested JSON keys into subcolumns for query efficiency, as demonstrated below.
To define a JSON column, you can provide optional settings like max_dynamic_paths in the column definition, which controls how ClickHouse handles dynamic paths [incoming JSON fields whose schema or structure is unknown].
Understanding this is crucial to the solution we finally designed.
Understanding max_dynamic_paths
The setting max_dynamic_path , limits the number of distinct JSON paths it will treat as separate subcolumns for any given chunk of data. This limit is defined at the table’s column level, but it is enforced per data part; each chunk of stored data [or “part”]. By default, this value falls back to 1024.
But for our customer logs, we can not have this limit.
Sometimes the incoming data can have really high cardinality [sigh], which could lead to an explosive avalanche of paths exhausting the upper limit. When the threshold is surpassed, if another distinct key appears, that key’s values [and any other new keys] will be stored in a shared data structure.
The next question that naturally arises is, what is a reasonable value for this setting to get optimal performance? Let’s dive deeper.
What is a reasonable maximum for JSON’s max_dynamic_paths?
The max_dynamic_paths setting controls how many unique JSON paths can be promoted to dedicated subcolumns per data part. The reasonable maximum is far from straightforward; it depends heavily on your data’s shape and the storage backend.
In most high-cardinality systems, like observability or event analytics platforms, customer-generated data contains extremely diverse JSON keys. A single dataset might include fields like order.id, order.user_id, or even arbitrary UUIDs (yes, seriously!) nested deep in the JSON structure. In such cases, even if you raise max_dynamic_paths to thousands, it gets consumed quickly because every unique key or UUID becomes a new path. No number ever feels enough when users continuously send data with new identifiers baked into the keys.
But what if we set max_dynamic_path = 0 and create columns for dynamic paths on demand.
Building a Two-Tier JSON Storage Model
By setting max_dynamic_path = 0, we stopped the creation of sub-columns for any JSON path. This meant that all the JSON data ingested is stored directly in the shared data structure, not as sub-columns.
This becomes our baseline. Now let’s talk about performance. The effect of the change on querying is better than what existed [storing logs as a string]. With the introduction of multiple JSON serialisation formats in ClickHouse, we faced yet another critical architectural decision —which format would deliver the best for our heavy workloads, especially for all the frequent GROUP BY queries?
Let’s examine that in greater detail.
#1. Storing Data in Advanced Serialisation Format
ClickHouse provides several serialisation formats for storing JSON data, including the Map type, bucketed maps, and the advanced JSON format. You can read more about these formats here.
We performed benchmarks on both map and advanced shared data structure and found there were some big wins for advanced shared data structure.
There were some big wins from opting for this format, which included better performance for aggregation and filtering of data; hence, operations like GROUP BY or WHERE clauses on specific JSON fields could be executed with high efficiency.
You can read more about advanced shared data structures here.
This became Tier 1 of our architecture.
#2. Promoting Frequently Queried Paths
While Tier 1 provides an efficient baseline for querying any JSON attribute, it is not optimised for fields that are accessed frequently. The overhead of checking metadata and decoding values becomes significant at scale for certain hot fields.
To address the performance challenges associated with querying large JSON objects in log data, we implemented Tier 2, designed to minimise query latency by separating frequently accessed fields from the larger, less-queried JSON blob.
The core of this optimisation is the use of two distinct JSON columns for storing log attributes:
Primary JSON Blob: A standard JSON column that serves as the default repository for all incoming log attributes, which was discussed in #1. This column accommodates the long tail of infrequently accessed fields.
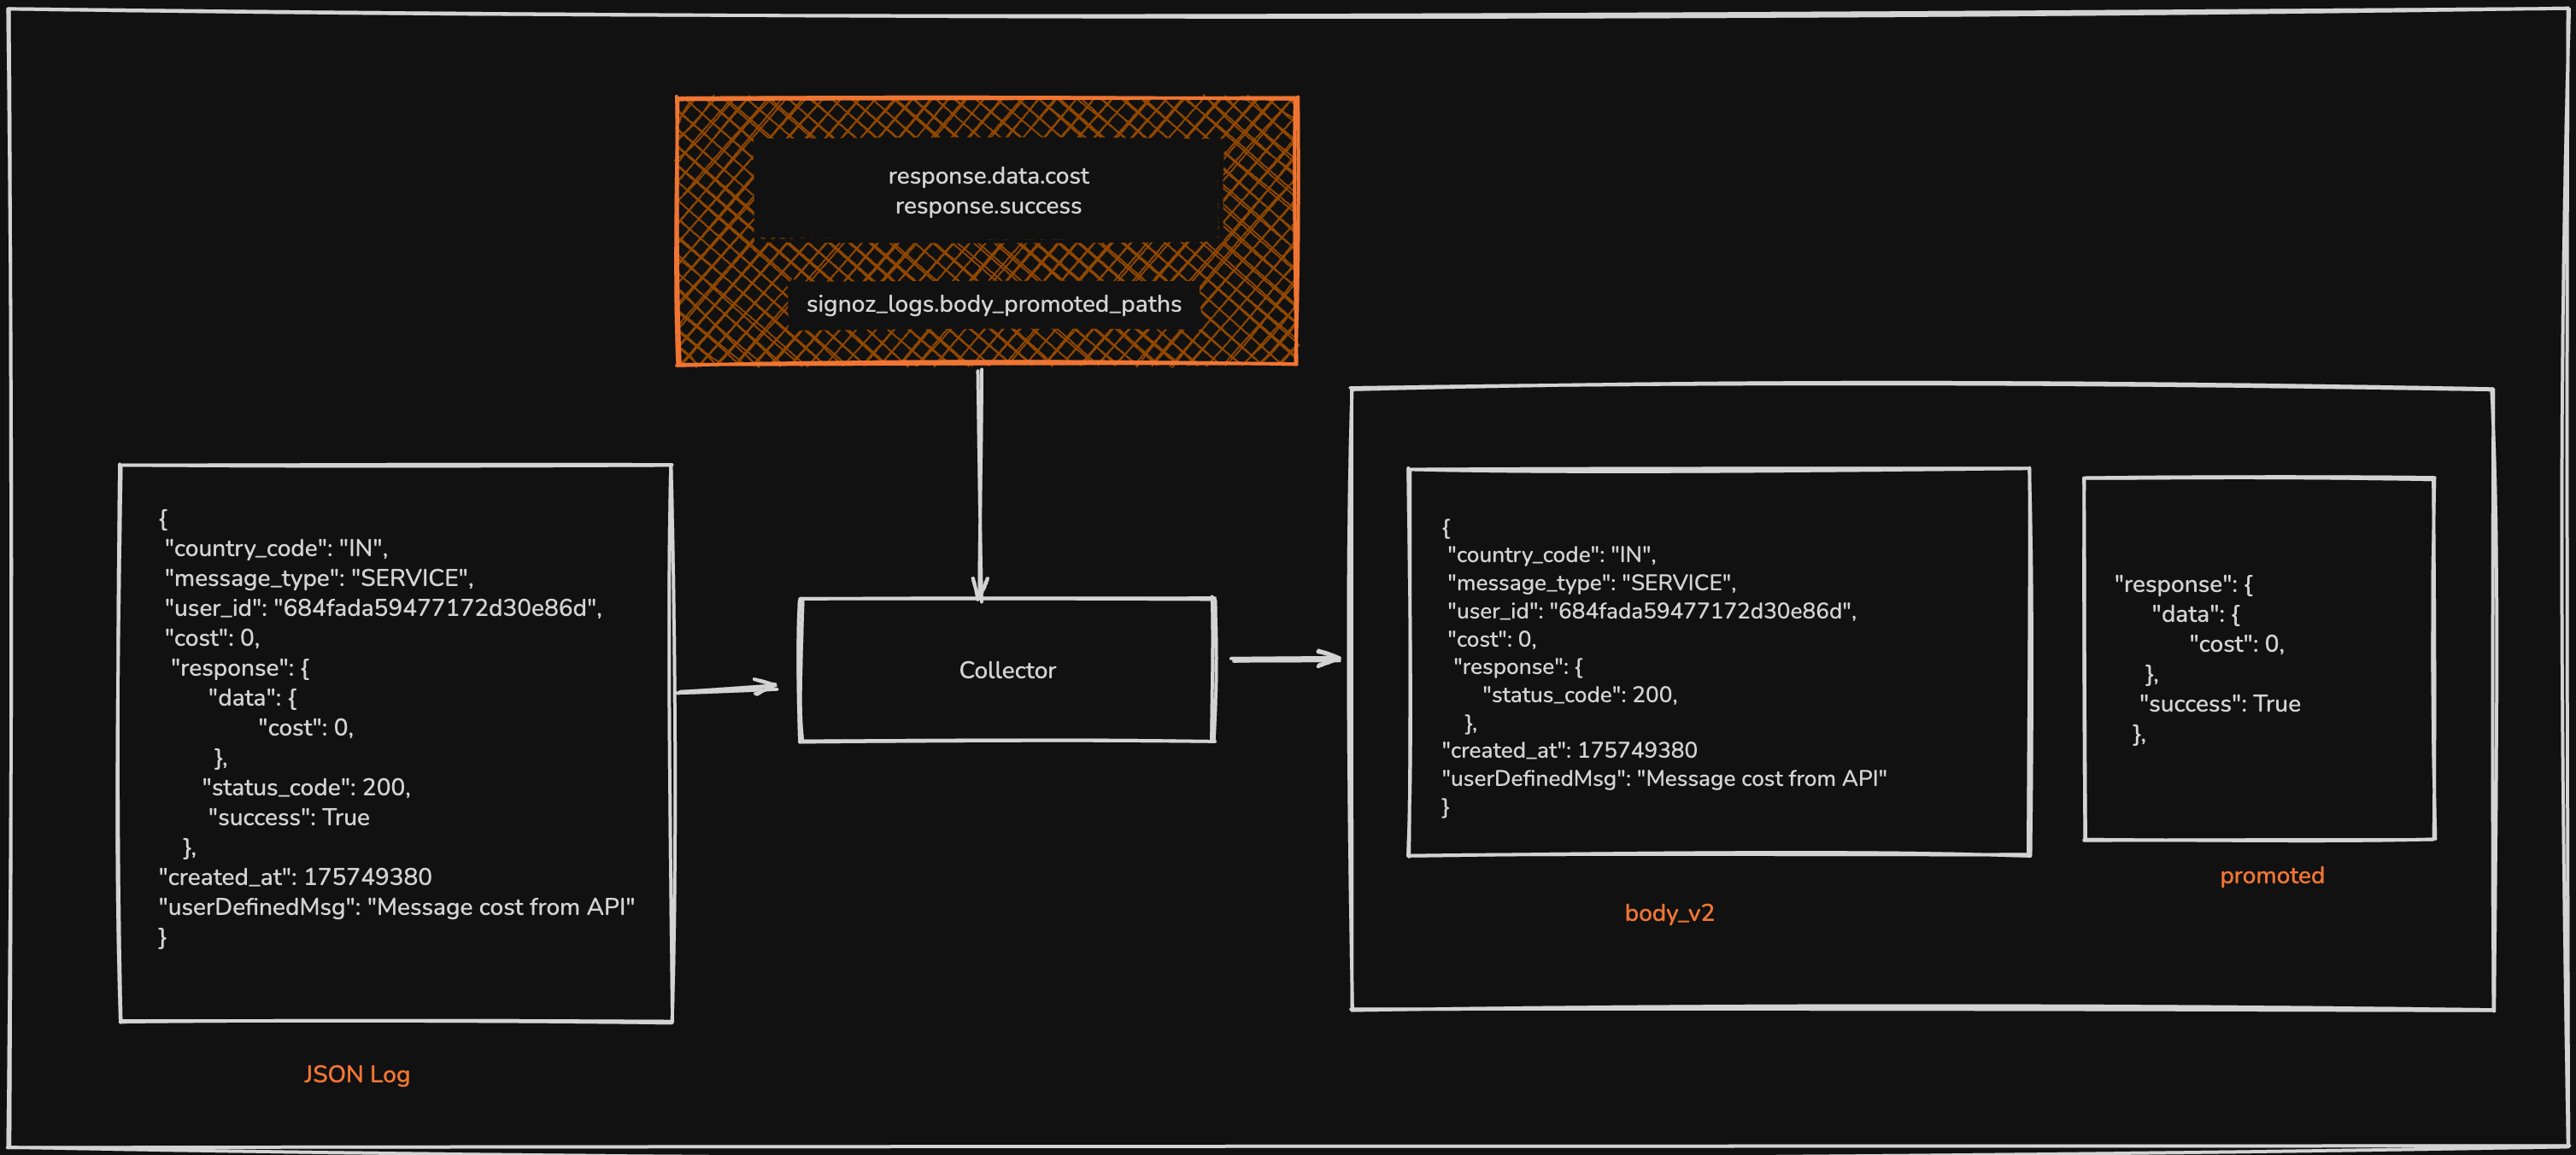
Secondary JSON Column: A second, specialised JSON column [promoted] is dedicated to storing key-value pairs that are frequently used in query filters, aggregations, and dashboards. This column is configured to leverage ClickHouse’s dynamic path settings (default of 1024), which we had set to zero for the primary blob. For example, a path/key called
body.status_codeis frequently queried, then it becomes stored in our secondary or promoted column.
This provides the expected performance with ClickHouse JSON columns, without compromising consistency in structure. But how does the system determine which fields are commonly queried? Let’s dissect that.
#3. Selecting and Ingesting Promoted Fields
Let’s think of it as a two-part process.
1/ If a user expects to increase performance over a certain key or path, it will be added to a separate table named promoted_paths , let’s call them as hot fields for now. Every 10 seconds, the ingestion service refreshes a cached list of these hot fields. If a new field gains prominence in queries, it is added to this cache list.
2/ During data ingestion, the ingestion service inspects each incoming log. If the log’s JSON payload contains keys that match the list of promoted fields in the cache list, those key-value pairs are extracted and moved into the secondary/ promoted column. To prevent data duplication and reduce storage overhead, these keys are simultaneously removed from the primary JSON blob.
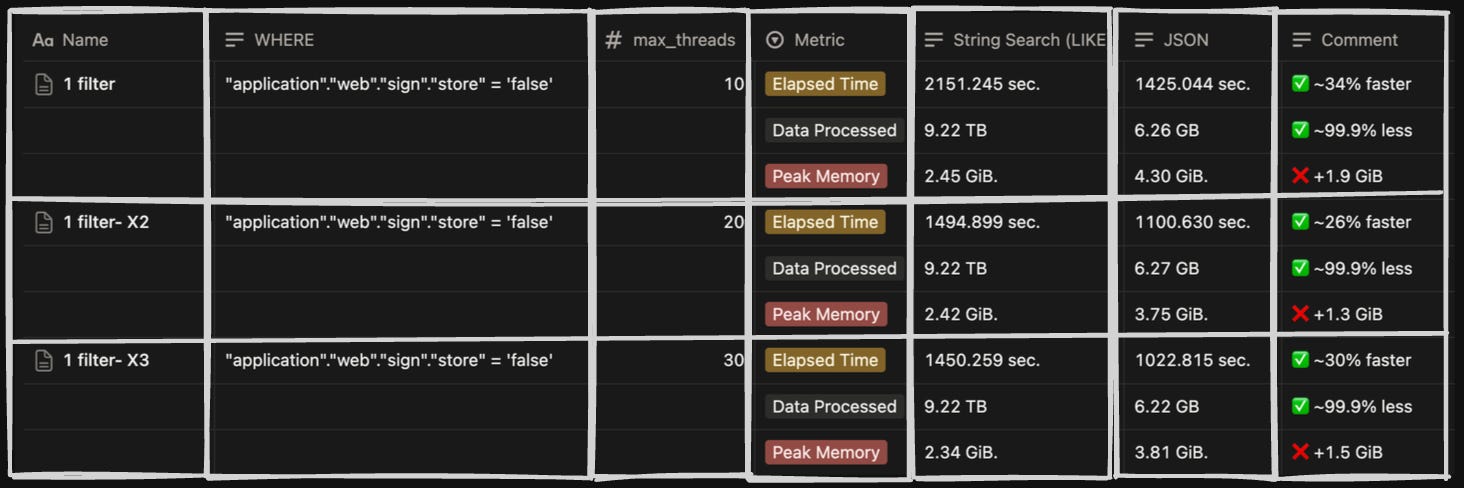
Comparing Results ~ 30% Faster, 100% Lighter
We compared the performance of the two-tier JSON model with the older String Column on filtering and group by queries.
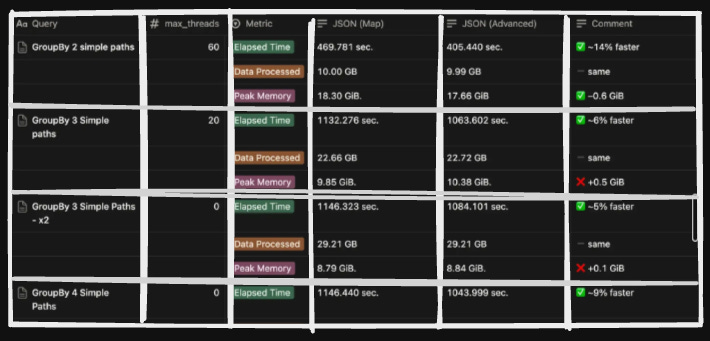
On testing the query performance with a 9TB dataset, we found that the JSON data type is 30% faster in execution time and scans around 99% less data, with a slightly higher memory usage.
Here are the stats for the comparison we did with different combinations of filters on both storage models.
Conclusion
This entire technical optimisation would enable customers to enjoy an enriched experience and query seamlessly without worrying about the shape and form of their data. With the two-tier model, the challenges that plagued our old system were systematically eliminated. Inconsistent JSON structures are now gracefully handled, with hot fields promoted and the rest stored efficiently. The slow string searches that once took minutes are now sub-second queries on structured data.
If you want to try our new logging experience, you can reach out to cloud-support@signoz.io.
If you loved this engineering deep-dive, here are some similar ones:
Feel free to check out our blogs and docs here. Our GitHub is over here, and while you are at it, we’d appreciate it if you sent a star ⭐ our way. You’re also welcome to join the conversation in our growing Slack community for the latest news!
How do handle data that was ingested before a path was promoted to "hot"? Those logs will have the path the primary column rather than the secondary.