Patterns for Deploying OTel Collector at Scale
As applications grow, the question quickly shifts from what OTel can do to how we can deploy it effectively at scale. In this post, we’ll explore some deployment patterns for the OTel Collector!

💌 Hey there, it’s Elizabeth from SigNoz!
This newsletter is an honest attempt to talk about all things - observability, OpenTelemetry, open-source and the engineering in between! We at SigNoz are a bunch of observability fanatics obsessed with OpenTelemetry and open-source, and we reckon it’s important to share what we know. If this passes your vibe-check, we’d be pleased if you’d subscribe. We’ll make it worth your while.
On another note, feel free to check out our blogs and docs here. Our GitHub is over here, and while you are at it, we’d appreciate it if you sent a star ⭐ our way. You’re also welcome to join the conversation in our growing Slack community for the latest news!
Cheers.
So, you’ve embraced OpenTelemetry, and it’s been great.
Pat, Pat.
That single, vendor-neutral pipeline for your traces, metrics, and logs felt like the future. But now, the future is getting bigger. That simple OTel Collector configuration that worked perfectly for a few services is starting to show its limits as you scale. The data volume is climbing, reliability is becoming a concern, and you’re wondering if that single collector instance is now a bottleneck waiting to happen.
You’re not alone. As applications grow, the question quickly shifts from what OTel can do to how we can deploy it effectively at scale. In this post, we’ll explore some deployment patterns for the OpenTelemetry Collector, moving from a simple agent to a robust, multi-layered architecture. Let’s look at the three main deployment patterns for OTel collectors and break down how each trades off complexity, scalability, and isolation; thus, choosing the right one depends on your architecture and goals.
#1. Load-Balanced/ Gateway Pattern
Instead of relying on a single, large OTel Collector, which you can also think of as a single point of failure 😄, this pattern uses a fleet of identical, stateless collectors sitting behind a load balancer. The idea is to distribute the incoming telemetry data across this fleet, so if any single collector instance fails, the others can seamlessly take over its workload.
Architecture with the Load Balancer
The data flows through a few distinct layers, as shown in the figure below.
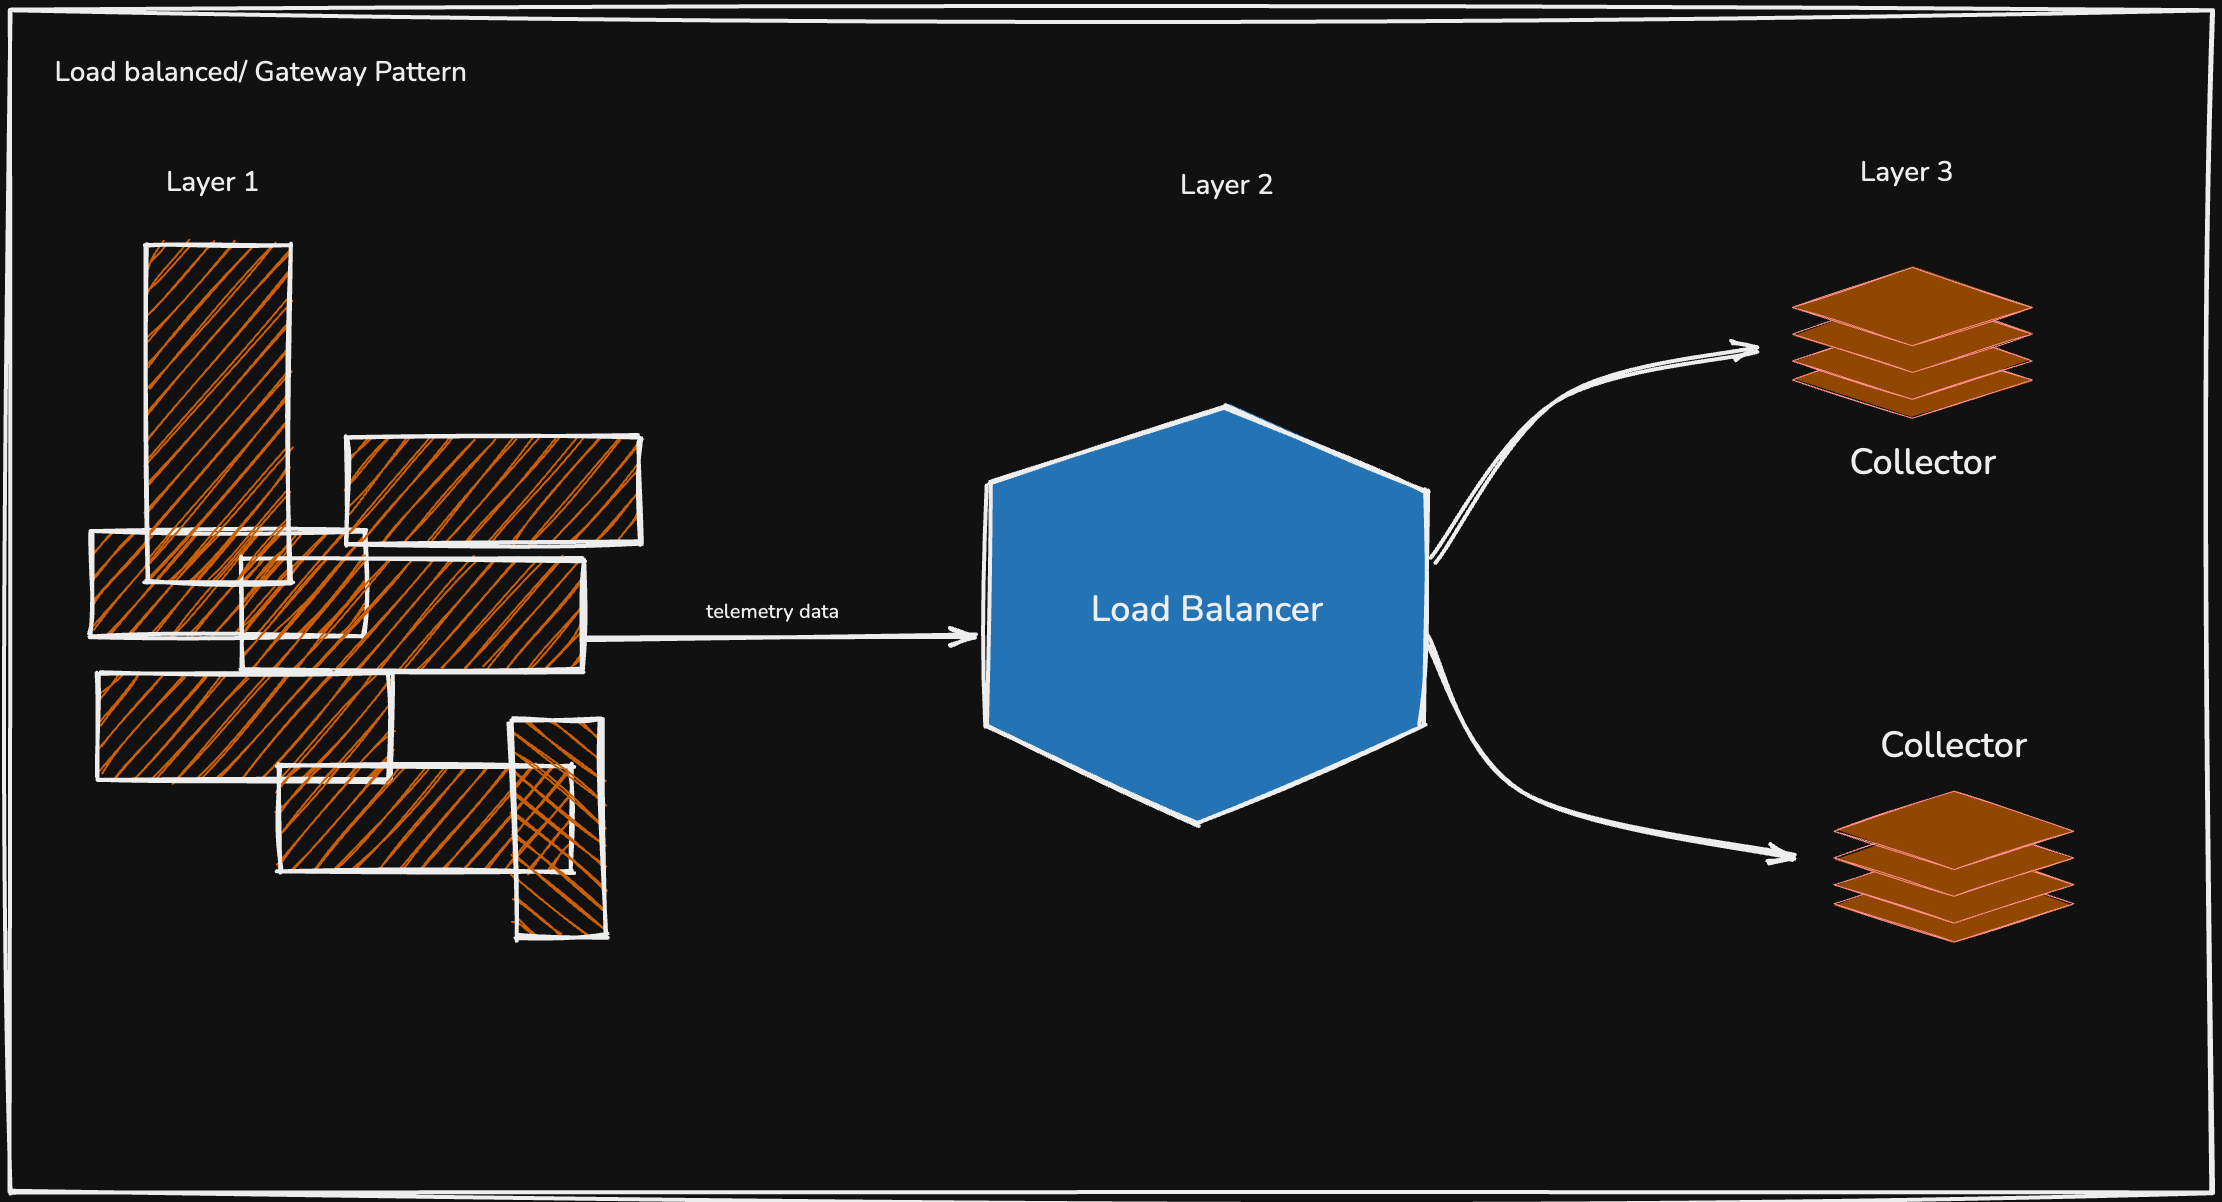
Layer 1: Agents
You still have OTel Collectors running as agents. These can be on individual hosts, as sidecars to your applications, or on a single Kubernetes node using a DaemonSet. The agent’s job is simply to collect data locally, batch it, and forward it to a single endpoint, the load balancer.
Layer 2: The Load Balancer
This is the central entry point for all telemetry data from your agents. It can be a cloud load balancer [like an AWS ELB/NLB or a GCP Load Balancer], or a self-hosted one like Nginx or HAProxy.
Its only job is to receive the data and distribute it across the fleet of gateway collectors using a strategy such as round-robin or a standard hashing algorithm.
Layer 3: The Gateway Collector Fleet
This is a group of two or more identical OTel Collector instances. They are the workhorses. Each collector in the fleet receives a fraction of the total data from the load balancer. They perform the heavy processing — advanced filtering, batching, retries, and exporting the data to one or more backends [e.g., SigNoz, Jaeger, etc.].
Trade-offs & Considerations
High Availability [HA]: If Collector 2 fails, the load balancer detects this and automatically redirects its traffic to Collector 1 and Collector 3. The pipeline remains up.
Horizontal Scalability: If your data volume doubles, you don’t need to make your collectors twice as powerful [vertical scaling]. You can simply add more collectors to the fleet [horizontal scaling].
Zero-Downtime Maintenance: You can perform rolling updates. Take one collector out of the load balancer’s pool, update it, and add it back. Repeat for the others without ever interrupting data flow.
Complexity: This architecture introduces a new component, the load balancer, which must also be configured, managed, and monitored.
Stateful Processors: This pattern is ideal for stateless processing. If you use OTel processors that rely on seeing all data for a given entity [e.g., the spanmetrics processor, which needs all spans for a trace], simply spraying data randomly can lead to incorrect results.
In such cases, you may need to configure your load balancer for “stickiness” or use a more advanced collector routing mechanism to ensure related data is routed to the same instance.
#2. Multi-cluster/ Central Control-Plane Pattern
Using a simple deployment strategy across many Kubernetes clusters is causing growing problems. It becomes hard to maintain consistent configurations and control your data with global rules.
Managing each cluster separately also creates security risks by storing credentials across multiple systems. At the same time, costs increase as each cluster sends data over expensive networks. The multi-cluster pattern fixes this by creating a central pipeline, making your data management secure, cost-effective, and easier to control.
The Multi-Stage Architecture
This pattern typically involves at least two layers of collectors, creating a collect and forward chain.
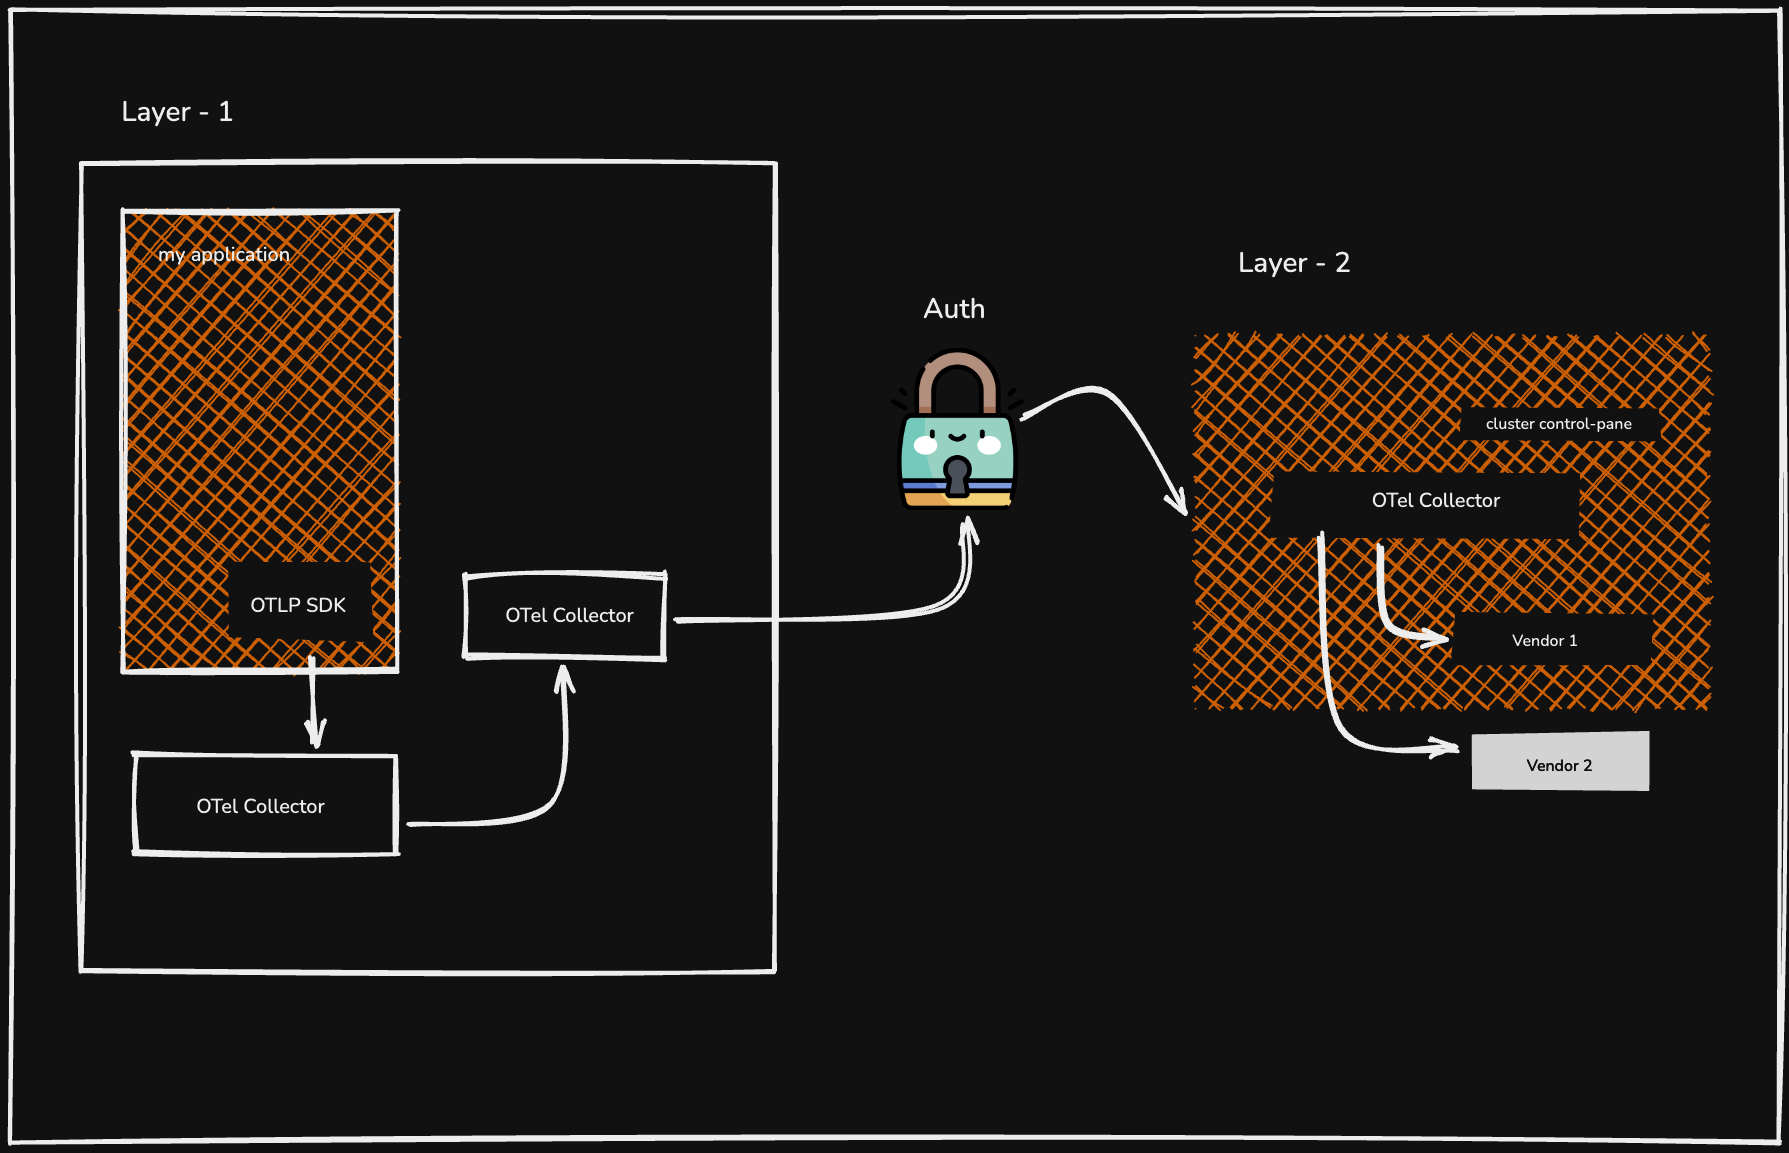
Layer 1: In-Cluster Collection [The Agent Layer]
Inside each of your Kubernetes clusters, you run a local OTel deployment. This usually consists of a DaemonSet of collectors acting as agents [one per node] that scrape local data. These agents then forward their data to a small in-cluster gateway [a Deployment within the same cluster].
The primary role of this layer is to collect all data within its own cluster, add cluster-specific metadata [e.g., cluster.name: prod-us-east-1], and forward it to the next stage.
Layer 2: Regional Aggregation [The Gateway Layer]
This layer involves a central, highly available fleet of OTel Collectors to serve an entire region or logical environment [e.g., all US-East production clusters]. This regional gateway receives data from the in-cluster gateways of all the clusters it manages.
This is also where you can centralise your logic. The regional gateway handles:
Authenticating with the final observability backends.
Enforcing global sampling rules.
Enriching data with region-level metadata.
Routing data to different backends based on type or team.
Trade-offs & Consideration
Enhanced Security: Only the regional gateways need the secrets to connect to your final backends. The collectors inside your many clusters do not significantly reduce your security footprint.
Centralised Management: You can manage your primary configuration [export destinations, sampling, etc.] in one place [the regional gateway] rather than in dozens. This makes updates and policy changes simple and consistent.
Sizing: Each layer of the pipeline must be sized and scaled appropriately to handle the data volume from the layer below it.
Network Paths: Ensure reliable, secure network connectivity between your clusters and the regional gateway.
#3. Per Signal Pattern
This pattern involves creating separate, parallel pipelines for each telemetry signal type, i.e, instead of a single, unified OTel Collector fleet that processes all signals together, you deploy specialised fleets — one for traces, one for metrics, and one for logs.
Architecture with Agents & Routing
The OTel agents are configured to collect all signals as usual. At the first possible stage [either in the agent itself or in a simple first-layer gateway], the data is split. The OTel Collector’s routing processor is often used here.
All traces are routed to the Trace Gateway fleet.
All metrics are routed to the Metrics Gateway fleet.
All logs are routed to the Logs Gateway fleet.
Each gateway fleet is configured and optimised only for its specific signal type, with its own set of processors, and exports to its corresponding observability backend like SigNoz.
Trade-Offs & Consideration
Independent Scalability: You can scale your logging fleet to handle huge volumes without over-provisioning your tracing or metrics pipelines.
Resource Optimisation: You can use CPU-optimised instances for your log collectors and memory-optimised instances for trace collectors, depending on load and necessity.
Higher Operational Overhead: You are now managing three or more separate collector fleets, each with its own configuration, deployment pipeline, and monitoring. Might get tiring!
Signal Correlation: It becomes more difficult to correlate signals at the collector level [e.g., using the spanmetrics processor to generate metrics from traces], as the data is already on separate paths.
How To Choose the Right Deployment?
The short answer is that there is no hard-and-fast rule for what is right. But we have put out a small guide that can help you understand some potential options you can explore.
If you have many clusters or regions that need unified telemetry, use the multi-cluster [control-plane] pattern. Designate one cluster as the central collector host, and configure each cluster’s agent/sidecar to export to it. This way, you get consistent processing [e.g. cross-cluster tail sampling] at the cost of cross-cluster links.
OR If different teams or customers must be isolated for privacy or regulatory compliance reasons (which are now getting stricter!), use a multi-tenant pipeline strategy. For example, tag data by team and have the collector route it to separate backends or processing paths. This limits the blast radius; one team/tenant’s misconfiguration won’t contaminate another’s data.
OR
When you need maximum ingestion throughput and uptime, deploy a load-balanced collector. Put collectors behind a robust L7 load balancer so you can autoscale instances on demand. This handles bursts by spreading the load and avoiding any single Collector becoming a bottleneck.
OR
If your metrics/trace/log volumes differ greatly, consider splitting pipelines by signal. As we mentioned above, run one collector for metrics [allowing many scraper replicas] and another for traces [optimised for tail sampling]. This lets you scale each pipeline to its workload without interference.
OR
For small deployments or strict budget constraints, start with a single Collector or node-level agents/sidecars to minimise infrastructure costs. As load grows or performance demands rise, move to more complex patterns: for example, add a gateway layer or switch to a load-balanced, multi-instance setup. Conversely, if ultra-low latency and resilience are paramount, an agent-and-gateway hybrid [per-node agents forwarding to central gateways] offers local buffering and global control.
Words of Wisdom from the Field
Here are some snippets with Sreekanth Chekuri, who is a Senior Software Engineer at SigNoz and also a contributor to OpenTelemetry. We hope some of these pointers will help guide you when designing the architecture for deploying your OTel collectors!

Maximising Performance and Throughput
Embrace Batching for Efficiency: He points out that a simple change like batching your data [e.g., up to 25k entries] significantly improves throughput. This works because it reduces unnecessary system calls and processing overhead, letting your pipeline work smarter.
The Power of Resource Scrutiny: Remember that resource requirements aren’t static. If your collector is doing heavy data transformation like parsing complex logs or extracting attributes, it will naturally need more CPU and memory. Always size your Collector based on the processing load, not just the ingestion rate.
Strategic Collector Deployment
Split by Signal for Precision: For optimal resource allocation, Sreekanth recommends running separate collectors for different signals. This allows you to allocate memory and CPU precisely where needed, avoiding a single resource hog.
Handle Traces with Care: Be mindful that tail-based sampling for traces is memory-intensive and requires specialised handling. If you mix this heavy operation with standard log or metric processing, it can impact the reliability of your entire system. Splitting these signals solves that problem.
Cautions
Know Your Tools: While alternative data pipelines exist, he cautions against simply swapping out the OpenTelemetry Collector for tools like Vector. You risk losing the many powerful, built-in capabilities and standardised features that the OTel ecosystem provides.
Watch Out for CPU Hogs: Some OTel processors, such as the transform processor, can be highly CPU-intensive. Use them judiciously, as they can significantly impact performance and scalability if overused in a high-throughput environment.
Thanks to Juraci for suggesting some edits to the initial version of this blog! Also, for his GitHub repository, which acted as a guidepost while I was learning about various patterns.
This topic never gets old and deserves to be shared every now and then!
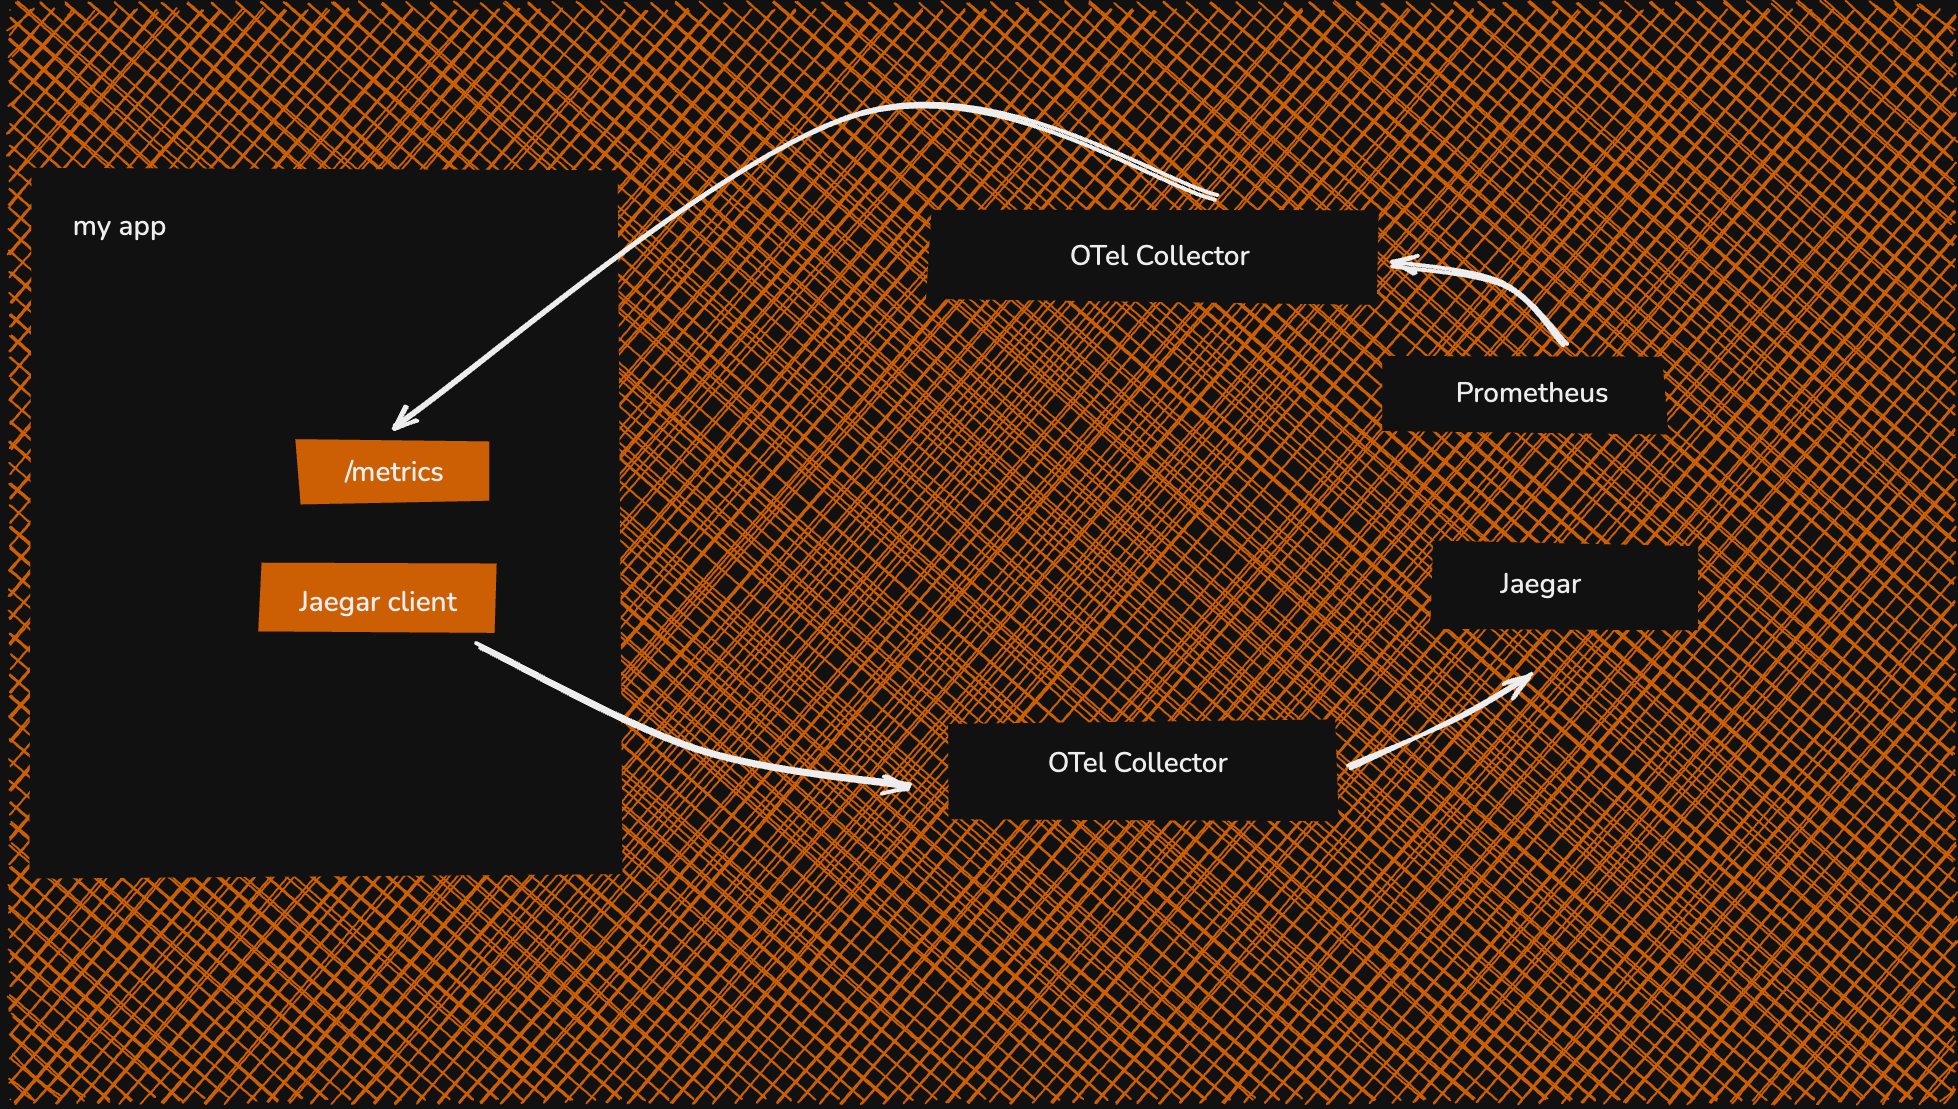
However! On the per signal strategy, which is the pattern #7 in the canonical reference, the "/metrics" refers to the metrics that are exposed by a Prometheus client. I don't think anybody scrapes /logs or /traces out of their applications. If you have all signals in OTLP format, then getting them out as fast as possible to a single external collector is preferable, having the split happen one layer later. It's a lot of work to reconfigure all your pods if you need them to point to a different address on a per signal basis.
Here's the repo I created some years ago with the OpenTelemetry Collector patterns:
https://github.com/jpkrohling/opentelemetry-collector-deployment-patterns