Saving Money with Sampling Strategies Beyond Head and Tail-based Sampling
I decided to go down the rabbit hole to find the strategies that don’t get the spotlight and make this edition about the lesser-known types of sampling.

💌 Hey there, it’s Elizabeth from SigNoz!
This newsletter is an honest attempt to talk about all things - observability, OpenTelemetry, open-source and the engineering in between! We at SigNoz are a bunch of observability fanatics obsessed with OpenTelemetry and open-source, and we reckon it’s important to share what we know. If this passes your vibe-check, we’d be pleased if you’d subscribe. We’ll make it worth your while.
When I first encountered sampling about a year ago, I knew only about head- and tail-based sampling. Mainly because most mainstream documentation covered primarily about them.
But recently, I realised I’d only been looking at the tip of the iceberg.
I stumbled upon an article that discussed sampling in greater depth. I decided to go down the rabbit hole to find the strategies that don’t get the spotlight and make this edition about the lesser-known types of sampling.

Let’s look at them in greater detail.
#1. Remote Sampling
To put it simply, it’s head-based sampling, but centrally controlled. Each service fetches sampling rules from a central config server. You can specify default and per-endpoint rates in a JSON file, and applications poll for updates periodically. If you are still wondering what the bigger deal is, it is that we can increase or decrease the sampling rate during incidents by changing this file, and within a minute, the applications pick up the new sampling rates.
That is quite powerful. Despite being battle-tested (used in Uber!), there’s surprisingly little documentation in OpenTelemetry. Users often struggle to enable Jaeger-style remote sampling with OTel. Some resort to running a Jaeger agent solely to serve the sampling config. OpenTelemetry supports it, but there is very little documentation. Remote sampling lets you keep a low baseline sample rate (say, 1-5%) most of the time and only ramp up to 50-100% when needed, such as during an incident or a debugging session. Because you don’t need a redeploy, teams are more likely to actually adjust rates to control costs or get details when it matters.
#2. Consistent Reservoir Sampling
It’s essentially head-based sampling that guarantees a fixed sample size. Instead of a simple random percentage, a reservoir sampler maintains a rolling buffer of traces, retaining exactly N traces per time window by using a discrete set of sampling rates and consistency algorithms to ensure fair selection.
Probabilistic sampling yields a variable number of samples, i.e if traffic doubles, so do your sampled traces and costs. Reservoir sampling always uses a fixed sample size. It’s statistically representative because the algorithm rotates items in the reservoir with uniform probability.
This strategy essentially puts a hard ceiling on trace ingestion. It’s ideal for ensuring you don’t exceed your budget, even during traffic spikes. The trade-off is that during very low-traffic periods, you might underutilise capacity, but usually most teams prefer predictable costs to a few extra traces.
#3. Metrics-from-Traces
You can sample traces aggressively, for example, only keep 5%, but still extract metrics from 100% of them before they’re dropped. In practice, this means placing a metrics-generation stage in your telemetry pipeline before the sampling stage. OpenTelemetry makes this possible with components such as Span Metrics and Service Graph.
If we naively sample traces, we also lose information needed for metrics such as request rates, error counts, and latencies. One solution is to tally up metrics before any sampling decisions.
In an OTel Collector, we might chain a spanmetrics connector in the pipeline, then a Sampling processor after it. SpanMetrics will emit metrics (RED metrics such as request rate, error count, latency distributions, service call graphs, etc.) for every span that passes through, so you get complete coverage. Then the sampler (head or tail) drops, say, 95% of spans before storage. The result is that our monitoring dashboards and alerts, which rely on metrics, remain 100% correct, while your trace storage volume is only 5% of raw traffic.
#4. Byte-Rate Limiting (Throttle by Data Volume)
This refers to sampling based on the size of traces, not just the count. This is an often-overlooked but effective strategy, you set a cap, such as ingesting at most 10 MB of trace data per second. The sampler then makes decisions to stay under that throughput. OpenTelemetry recently added a bytes_limiting policy in the tail-sampling processor for this. You can read more about it here.
It uses a token bucket algorithm, which is common for rate limiting, but the tokens represent bytes. The collector actually measures the size of each trace in bytes, using the protobuf serialised size to accurately account for how much data each trace would consume. You configure a sustained bytes-per-second rate and a burst capacity. For example:
policies:
  - name: volume-limit
    type: bytes_limiting
    bytes_limiting:
      bytes_per_second: 10485760  # 10 MB per second
      burst_capacity: 20971520   # allow bursts up to 20 MB
If a few gigantic traces arrive, the processor will quickly use up the token budget and start dropping subsequent traces until the rate falls back under 10 MB/s. Conversely, if traces are small, more can pass through until the aggregate size hits the limit.
This becomes extremely useful when trace sizes vary a lot. For instance, one request might normally produce a 50 KB trace, but a worst-case code path might generate a 5 MB trace. A standard sampler working per-trace might keep both equally, but the latter one trace costs as much as 100 smaller ones.
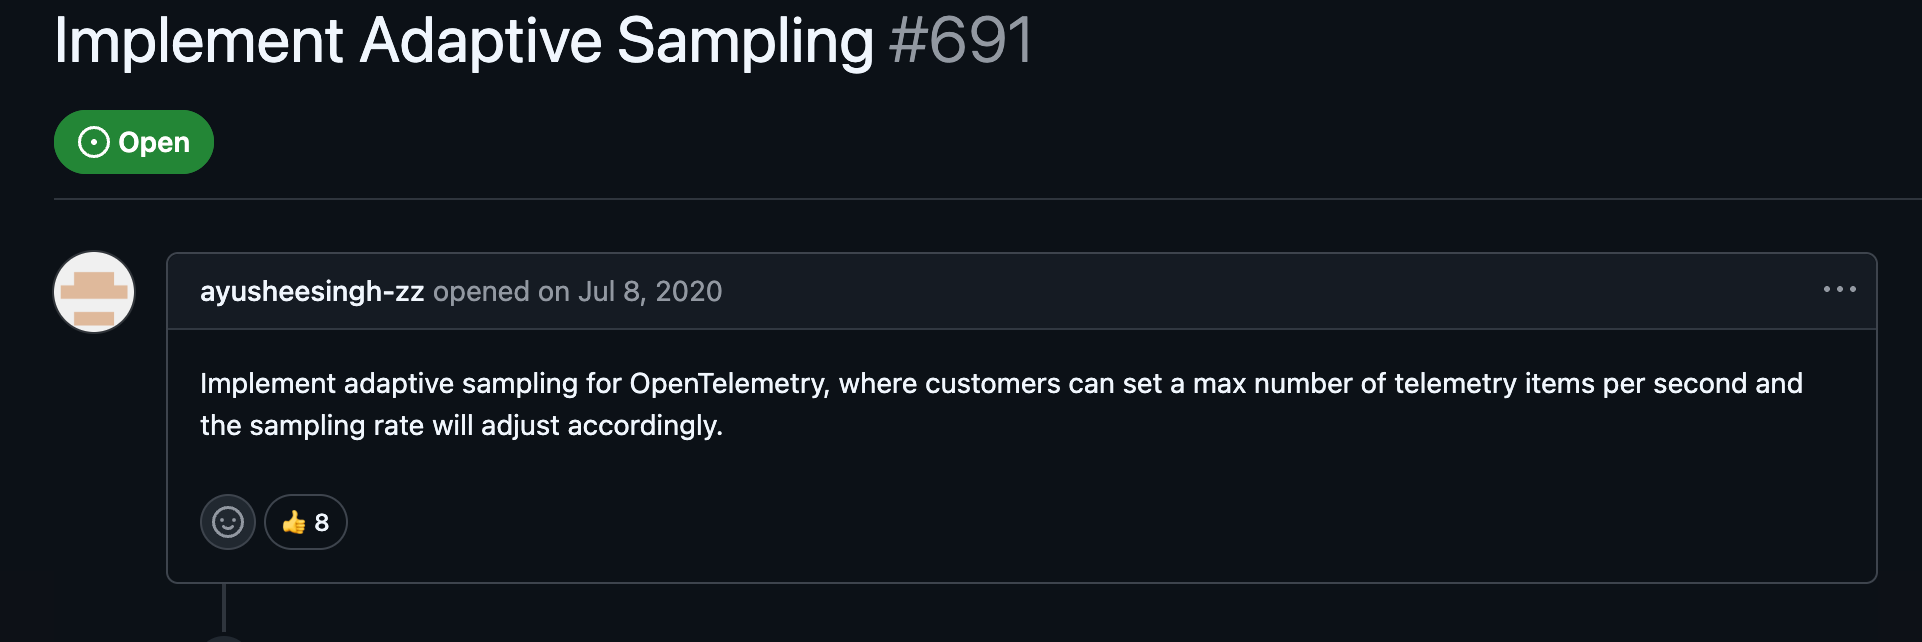
#5. Adaptive Sampling
Adaptive sampling adjusts trace sampling rates in real-time based on live traffic patterns or performance signals. The goal here is to keep overall data volume within budget while dynamically increasing sampling during anomalous events. For instance, you might normally sample only a small percentage of requests, but automatically raise the sample rate when latency or error rates spike beyond an SLO threshold. One strategy is throughput-based adaptation; setting an upper limit on traces per second and letting the system tune the probability to meet that cap. Another is key-based dynamic sampling, where the collector samples frequent events less and rare events more.
Here’s an interesting GitHub thread.
Adaptive schemes keep observability costs predictable by avoiding oversampling during high-traffic periods, yet they can temporarily boost fidelity when something goes wrong.
Care must be taken to ensure coordination across distributed services so that increasing sampling doesn’t overload the system or skew the data.
In my opinion, the shift from conventional probabilistic sampling to the methods above reflects a change in how we view observability. Ultimately, the right sampling strategy aligns your visibility needs with your infrastructure budget, and as OpenTelemetry matures, it will likely become the new standard for any team operating at scale.