What is eBPF & What Does it Mean for Observability?
Decoding the buzz behind eBPF!

💌 Hey there, it’s Elizabeth from SigNoz!
This newsletter is an honest attempt to talk about all things - observability, OpenTelemetry, open-source and the engineering in between! We at SigNoz are a bunch of observability fanatics obsessed with OpenTelemetry and open-source, and we reckon it’s important to share what we know. If this passes your vibe-check, we’d be pleased if you’d subscribe. We’ll make it worth your while.
On another note, feel free to check out our blogs and docs here. Our GitHub is over here, and while you are at it, we’d appreciate it if you sent a star ⭐ our way. You’re also welcome to join the conversation in our growing Slack community for the latest news!
Cheers.
eBPF is kind of like matcha - it has been around for a long time, yet it’s only within the past couple of years that it emerged as one of the latest trends and buzzwords in the industry.
I can’t explain how matcha became the world’s most popular drink (maybe another time 😉), but I will take today’s blog as an opportunity to tell you how eBPF has become a big deal for revolutionising observability at the kernel level, among many other dope stuff. Let’s look at the history of eBPF, how it works, what problems it solves, and why you – yes, you! – should start taking advantage of it today.

What is eBPF?
eBPF - or the extended Berkeley Packet Filter, as it was formally known - is the name of a kernel execution engine that runs a variety of new programs in a performant and safe sandbox in the kernel.
If the above definition flew right past your head, let me simplify it. It’s almost like putting JavaScript into the Linux kernel. JavaScript can run programs safely in a browser sandbox similar to eBPF in a kernel.
With eBPF, developers can execute custom programs [typically in a restricted C syntax] and load them at runtime in kernel space without the need to modify kernel source code or add additional modules.
Originally derived from the classic BPF used for packet filtering, eBPF greatly extends its scope beyond networking to any part of the system. Since eBPF has evolved way beyond packet filtering, it’s almost an understatement to refer to it as “extended”, and the acronym is not in active use anymore.
If you are interested in the evolution of eBPF, ideas and thoughts in the early days, take a look at the documentary below. This is also a great example of all the work that went behind the scenes to get code merged in a large codebase like Linux.
How does eBPF work?
By now, we have established that eBPF is a crazy technology. What happens BTS of how eBPF programs function is even more mind-blowing. Let me take a moment to explain it in-depth.
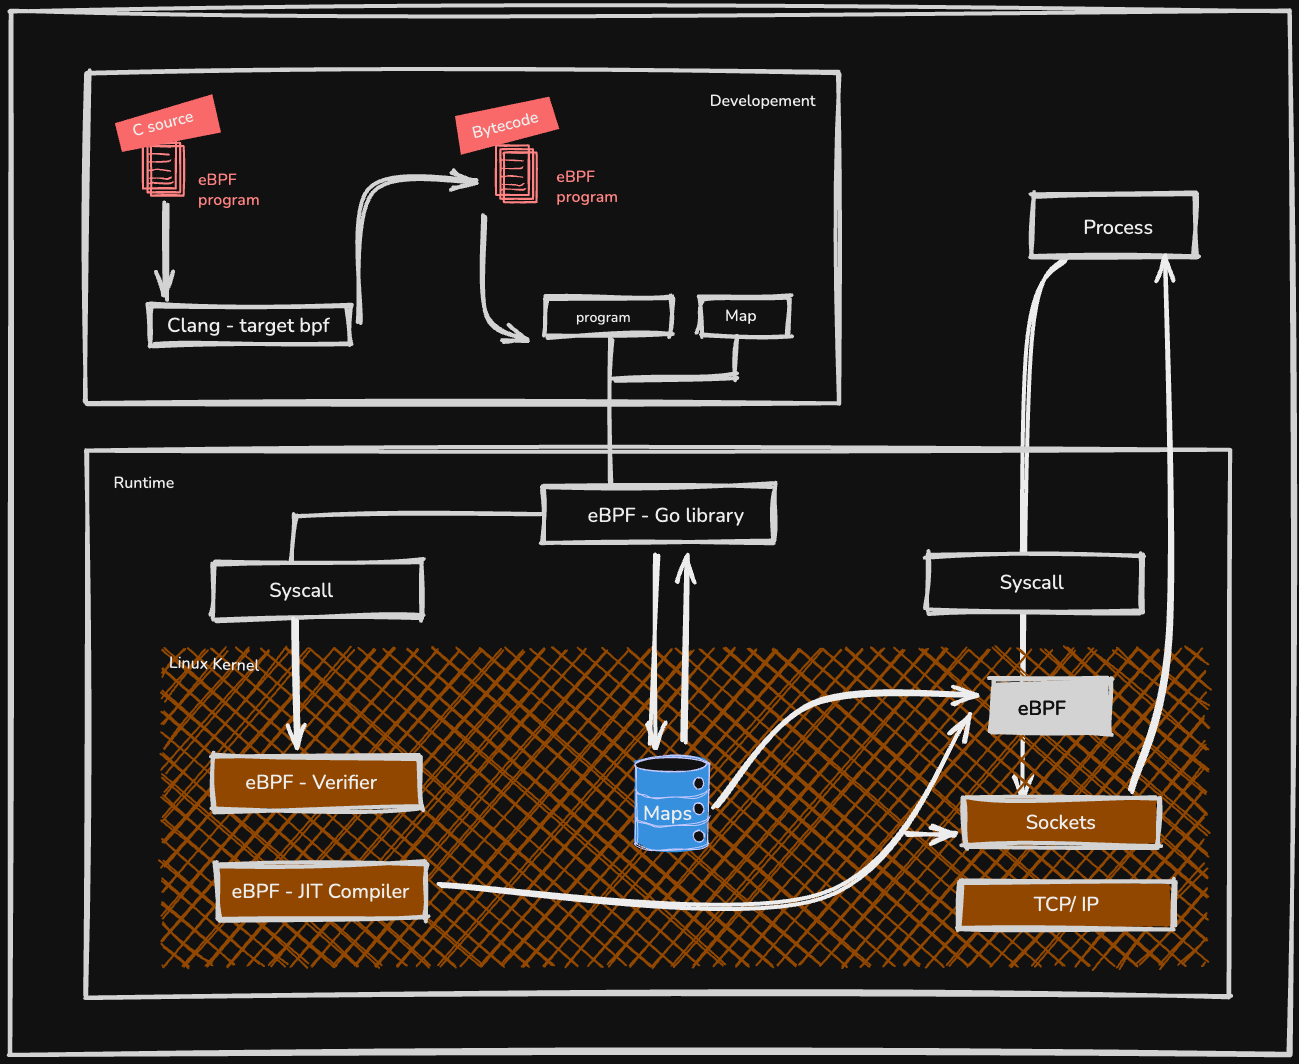
Step 1: Write an eBPF Program
Everything starts with writing the logic you want the kernel to execute. This is typically done in a restricted, C-like language. It’s not full C. For example, you can’t have unbounded loops or call just any function you want. The goal is to create a small, efficient piece of code that is guaranteed to run quickly and safely. Instead of calling standard libraries, eBPF programs use a special set of helper functions provided by the kernel to interact with the system, such as getting the current process ID or looking at network packet data.
Step 2: Compilation to Bytecode
Once the C code is written, it’s compiled into eBPF bytecode using a toolchain like Clang/LLVM. This bytecode is a universal, platform-independent instruction set that the Linux kernel can understand. This is similar to how Java code is compiled into bytecode to run on the Java Virtual Machine (JVM). In this case, the virtual machine is a secure one that lives inside the Linux kernel itself. The output is typically an ELF file containing the bytecode and definitions for any maps the program will use.
Step 3: Load the Program and Create Maps
This step is handled by a user-space application. This is a normal program you write in a language like Go, Rust, or Python that acts as the controller for your eBPF code. This application performs two key tasks:
It reads the eBPF bytecode from the file created in Step 2.
It uses a special system call (bpf()) to load that bytecode into the kernel.
At this stage, the user-space application also creates any eBPF maps the program needs. These maps are the crucial bridge for communication. They are key-value data structures that can be accessed by both the eBPF program in the kernel and the user-space application.
Step 4: Verification and JIT Compilation
This is the most critical step for ensuring safety and performance. As soon as the kernel receives the eBPF bytecode, it passes it to the Verifier. The verifier performs a static analysis of the code to prove that it is safe to run. It checks for infinite loops, out-of-bounds memory access, and illegal instructions. If the program fails verification, it is immediately rejected.
If the program passes verification, the kernel then uses a Just-In-Time (JIT) compiler to translate the eBPF bytecode into native machine code for the host CPU. This means the code doesn’t have to be interpreted, allowing it to run at nearly the same speed as natively compiled kernel code.
Step 5: Attach and Execute
After being loaded and verified, the eBPF program is in the kernel but is not yet active. The user-space application must explicitly attach it to a specific event hook. This could be:
A network interface, to inspect incoming/outgoing packets [XDP or TC hooks].
A system call entry/exit point [a tracepoint].
The entry or exit of a function in the kernel or a user-space application [kprobe or uprobe].
Once attached, the kernel will automatically trigger the eBPF program every time that event occurs [Yes, eBPF is event-driven!]. The program runs, performs its task [like updating a counter in an eBPF map], and exits all within the kernel context, making it incredibly fast. Meanwhile, the user-space application can periodically read from the eBPF map to collect the data and present it to the user.
eBPF for Observability
Let’s understand how eBPF could be used for observability by checking how it provides visibility into each of the three pillars.
Metrics
eBPF can be used to collect highly granular performance metrics that are impossible to see from the user space. For example, you can attach an eBPF program to kernel functions to precisely measure TCP retransmits, disk I/O latency, or time spent scheduling processes.
Logs
While not a replacement for traditional application logs, eBPF can generate highly contextual event logs. For example, you can create a log every time a process opens a sensitive file, writes to a specific socket, or executes a new program, complete with the process ID and user ID. This provides a powerful audit trail for security and debugging.
Traces
eBPF can automatically trace requests between services without any code changes. By observing the send() and recv() system calls made by applications, eBPF-powered tools can stitch together a distributed trace, even across different programming languages. It can even trace encrypted traffic [like HTTPS] by hooking into the application’s memory before the data is encrypted.
Tracing File Opens with eBPF
Let’s put the above theory into practice. Here’s a small example of how we can count the number of file opens with eBPF. We are controlling the eBPF program via Python. Since we are using the BCC [BPF Compiler Collection] framework, which is a popular Python library for writing and loading eBPF programs, we should have it installed.
Here’s the program/ script for the eBPF program that traces the openat() syscall, and logs the process ID, process name, and file path each time a file is opened.
from bcc import BPF

# eBPF program that hooks into the openat syscall
bpf_code = “”“
#include <uapi/linux/ptrace.h>
#include <linux/sched.h>

struct data_t {
    u32 pid;
    char comm[TASK_COMM_LEN];
    char fname[256];
};

BPF_PERF_OUTPUT(events);
int trace_openat(struct pt_regs *ctx, int dfd, const char __user *filename, int flags) {
    struct data_t data = {};

    // Capture process ID and name
    data.pid = bpf_get_current_pid_tgid() >> 32;
    bpf_get_current_comm(&data.comm, sizeof(data.comm));

    // Capture file name
    bpf_probe_read_user(&data.fname, sizeof(data.fname), filename);

    // Send the data to user-space
    events.perf_submit(ctx, &data, sizeof(data));
    return 0;
}
“”“

# Load the eBPF program
b = BPF(text=bpf_code)

# Attach eBPF program to the openat syscall
b.attach_kprobe(event=”sys_openat”, fn_name=”trace_openat”)

# Function to print the output
def print_event(cpu, data, size):
    event = b[”events”].event(data)
    print(f”PID: {event.pid}, Process: {event.comm.decode(’utf-8’)}, File: {event.fname.decode(’utf-8’, ‘replace’)}”)

# Open a perf buffer to receive events from kernel space
b[”events”].open_perf_buffer(print_event)

# Continuously listen for events and print them
while True:
    b.perf_buffer_poll()
Execute the script with root privileges, as eBPF requires them to load programs into the kernel.
sudo python3 <name _of_file>
Let’s break down the code into its two main parts.
The eBPF Program [The C Code]
This is the logic that runs securely inside the kernel.
struct data_t: We first define a C struct. This is the shape of the data we want to send from the kernel to our Python program. In our example, it holds the process ID, the command name, and the filename.BPF_PERF_OUTPUT(events): This is a BCC macro that creates a high-performance communication channel called events. It allows us to efficiently send data from the kernel to user space without slowing the system down.int trace_open(struct pt_regs *ctx): This is our main eBPF function. It gets the current process ID [pid] and command name [comm] using eBPF helper functions [bpf_get_current_pid_tgid() and bpf_get_current_comm()].The most important part is
bpf_probe_read_user_str(). The filename exists in the memory of the application making the system call, not in the kernel. This special helper function safely copies the filename string from the user’s application memory into ourdata. filenamevariable.Finally,
events.perf_submit()pushes our completed data structure into the events perf buffer, making it available to our Python script.
The User-Space Controller [The Python Code]
This Python script loads and manages the eBPF program.
b = BPF(text=bpf_program): This line is where the BCC magic happens. It takes our C code as a string, compiles it into eBPF bytecode, and loads it into the kernel. The kernel’s Verifier checks the bytecode to ensure it’s safe before allowing it to be loaded.b.attach_kprobe(...): This is the crucial step where we attach our trace_open C function to a kernel event. We use a kprobe [kernel probe] to hook into the kernel function that handles the openat system call. Now, every time any process on the system calls openat, our eBPF code will run first.b[”events”].open_perf_buffer(print_event): This tells our script to start listening to the events channel we created in the C code. For every piece of data that comes through, it will call our Python function print_event.while True: b.perf_buffer_poll(): This is the main event loop. The script sits here, efficiently waiting for data to arrive from the kernel. When data is available, it triggers the print_event callback to print the formatted output to your screen.
Once you run the script with root privileges, you will see output like this,
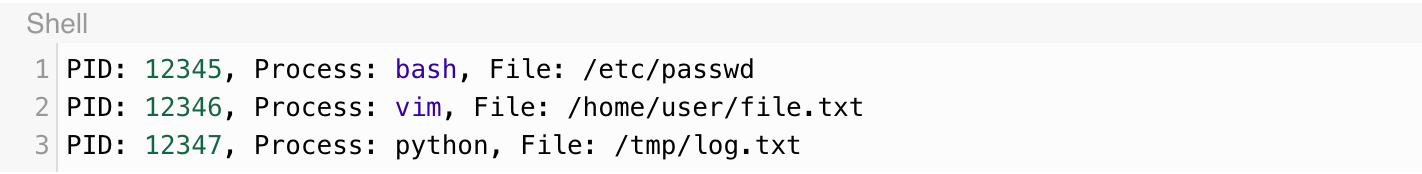
Although this is a very basic example, it gives a good insight into how eBPF programs work from code to monitoring calls. eBPF is no longer a niche technology, but something that is being widely adopted by orgs at various levels, revolutionising the tech industry — one matcha at a time. 🍵