Why Observability Isn’t Just for SREs (and How Devs Can Get Started)
This blog is an attempt for anyone lost to find their way into observability and a wake-up call for devs to they should think about observability more actively today than ever before.
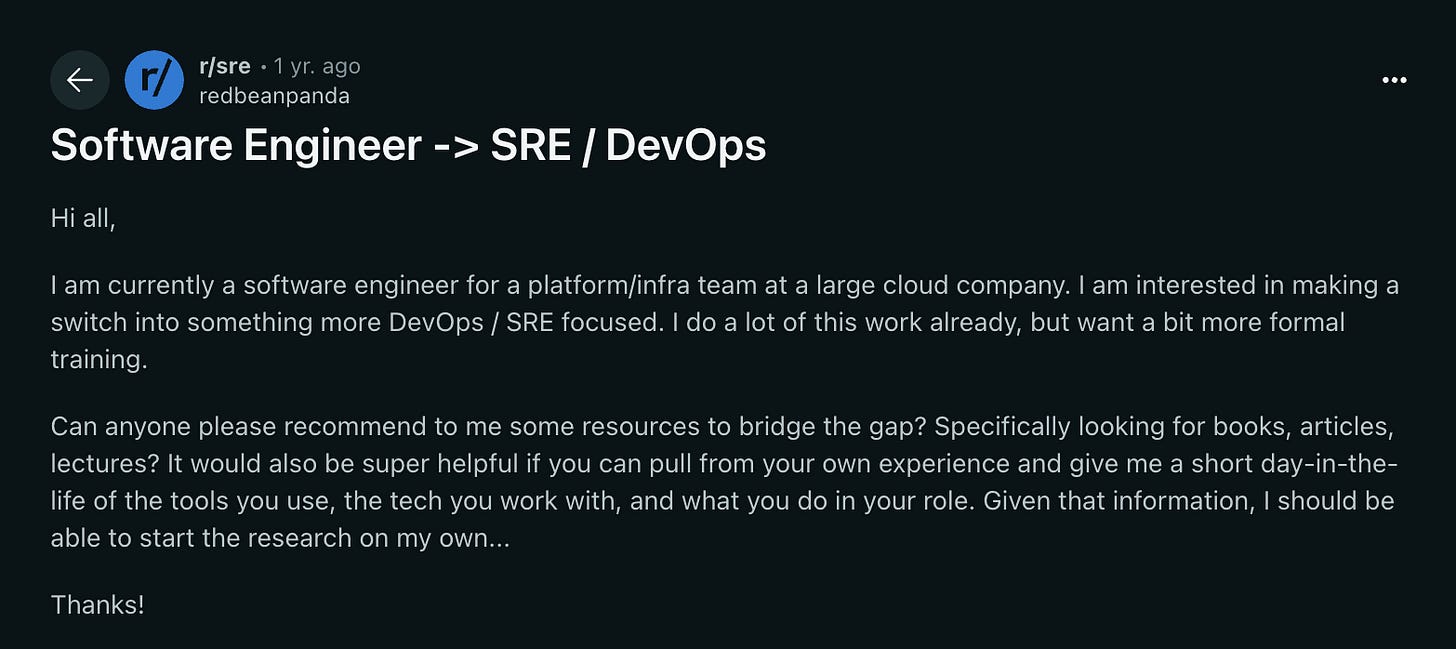
Almost every other day, when I scroll past r/devops or r/sre, I see a post like this asking how a dev can get started with devops, observability, etc.

Sample Reddit thread on how to get started with OTel
This blog is an attempt for anyone lost to find their way into observability and a wake-up call for devs to they should think about observability more actively today than ever before.
A dev’s observability playbook.
Why should you, a developer, care?
As devs, we often obsess over making our code neater, maintaining systems better, and reducing technical debt. We think of a couple of edge cases and handle them well. We write some tests, debug a bit, drink some hot brew, then call it a day. However, in 2025, I am unsure if this will make the cut.
Here’s a short elevator pitch on why you, as a developer, should care about observability today.
Product Engineers With Extreme Ownership
Gone are the days when a PM would hand you a requirements document and design, and then you would just code and then leave the testing to a QA and then whatever happens next to the SREs. The role of a dev has expanded beyond this.
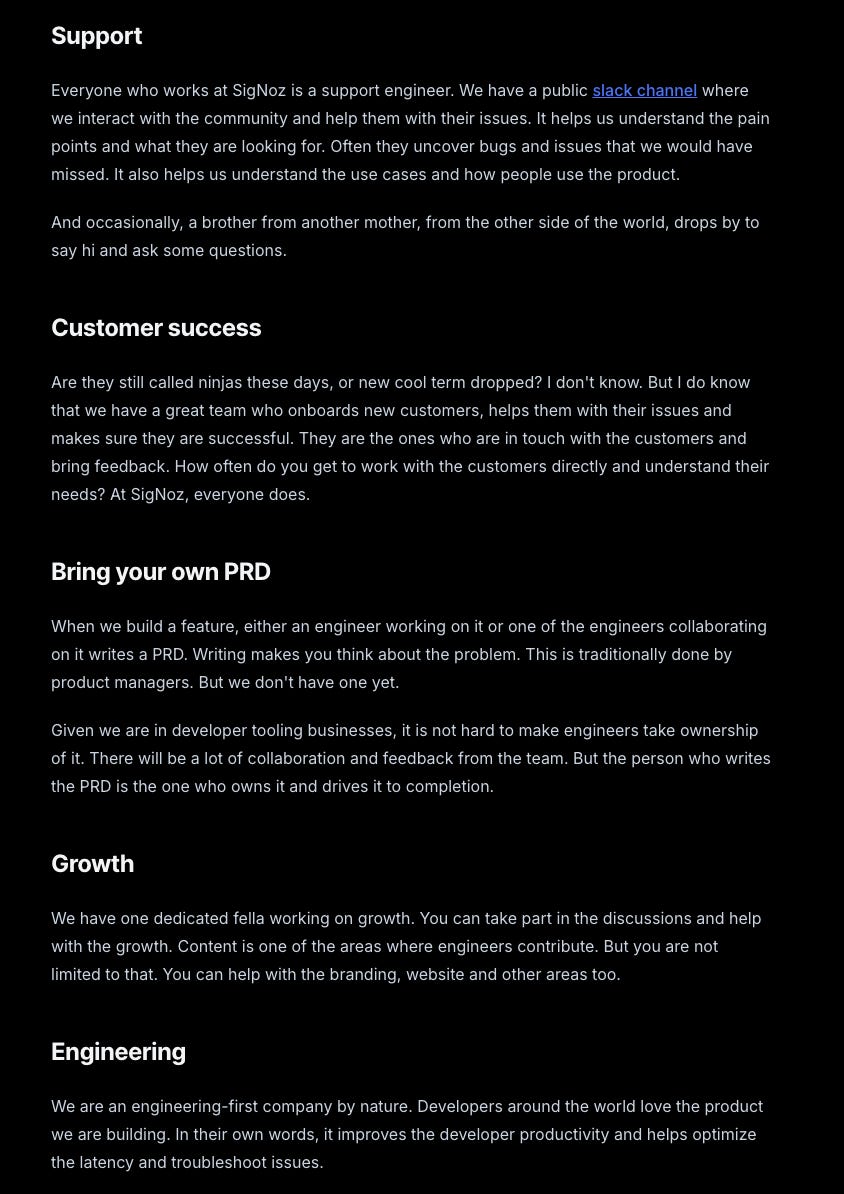
Here’s what a day in the life of a product/software engineer looks like today,

You are kind of expected to know everything, at least a little bit. Companies increasingly value product engineers who own the full lifecycle of a feature from design to coding to deployment and monitoring. It means you, the developer, need to know when your application misbehaves in the wild and be ready to fix it, which is exactly what observability enables.
Systems are Scaling Faster (and getting more complex)
Modern software architectures have exploded in scale and complexity. We’re building distributed microservices, deploying to clouds and Kubernetes, handling global user traffic and shipping faster than ever before. When hundreds of containers or functions communicate with each other, failures often cascade in unpredictable ways. We thrive on getting a holistic view of these complex systems, which is exactly what observability solves for.
Testing every Edge Case isn’t Feasible
Building something as simple as an input box itself can include a multitude of edge cases.
What if the input is too short or too long?
What if there’s a special character in the input?
How to handle white spaces?
How to handle SQL injection?
These are a few from the top of my mind. However, testing and brainstorming for potential edge cases can become increasingly cumbersome as systems become more complex.
Observability acts as your safety net, catching issues that slip through testing and helping you understand real-world system behaviour.
Users don’t like bugs, but they HATE slow resolution more
As an end-user for a lot of products, I am very impatient when something stops working. So I can imagine what users feel like when their product doesn’t work as expected. Bugs and outages are never welcome, but what really frustrates users is when issues drag on without a fix.
We are in a highly fast-paced world, where no one waits for anything, and users have zero tolerance for downtime or latency. Performance of systems is mission-critical. Every hour of downtime or a delayed fix can cost a substantial amount.
Observability is what makes rapid resolution possible; it helps you spot issues immediately and pinpoint the root cause without wasting time, and directly translates to customer retention.
Observability: Beyond APM and Infra Monitoring
So what’s the point of observability, anyway?
Is it just a fancy word for monitoring?
Not really.
Traditional Application Performance Monitoring [APM] and infrastructure monitoring are about tracking known metrics [CPU, memory, request latency, etc.] and alerting on predefined thresholds. Observability goes beyond that by enabling you to infer the internal state of the system from its outputs.
It’s often defined by three pillars of telemetry data — logs, metrics, and traces, but there’s more to it. Together, they give you a 360° view of what’s happening inside your applications.
Logs are the record of events [think of them as your app’s diary of what it’s doing].
Metrics are numeric measurements [e.g. memory at 75%, 500 requests/minute] that track trends and health.
Traces follow the path of a single request or transaction through multiple services [useful in microservices to see how a request flows and where it slows down].
Observability tools unify these signals to help you answer new questions about your system’s behaviour, not just the ones you preset.
For example, a classic monitor might tell you the error rate exceeded 5% and something’s wrong, whereas an observability approach lets you dig in and ask why it’s wrong, which users or inputs caused this? What else was happening on the system at that time?
It’s a more exploratory, investigative mindset.
Crucially, observability isn’t limited to just application performance like APM is. Today it has expanded to cover the health of the entire system, including infrastructure and third-party services. APM might catch known issues [say, a slow database query you anticipated], but observability will help surface the weird, unexpected issues that weren’t explicitly looked for.
Hello World, OpenTelemetry.
By now, hopefully, it’s clear why you should care about observing your systems actively. The next obvious question is how you can achieve it as a developer.
Your observability tooling will often be influenced by what your org has already adopted. Many teams inherit an existing monitoring stack, maybe Prometheus for metrics [along with dashboards powered by PromQL], or a log system that uses LogQL. These tools may already be wired into alerting pipelines, dashboards, and operational runbooks. In such cases, it’s wise to continue using what’s already working well.
The good news is that OpenTelemetry plays nicely with many of these tools, so you can gradually adopt it without disrupting what’s in place.
That said, if you are starting on a fresh slate, I’d strongly recommend OpenTelemetry [OTel]. The advantages that OTel brings to the table are plenty. You can read more about the advantages of having a vendor-agnostic and open-source observability framework from OTel’s official docs.
OpenTelemetry in < 200 words
At its core, OTel introduces the idea of signals, primarily traces, metrics, and logs, that describe what your application is doing. Developers use the OTel API to create and emit these signals, while the OTel SDK handles the heavy lifting of batching, processing, and exporting the data to your chosen backend.
Instrumentation [the process of collecting these signals] can be done automatically or manually. Usually, it’s a humble mix of both.
Once instrumented, your application will emit trace spans, metrics, and logs in OTel’s standard formats. You can configure exporters to send that data to various backends, whether that’s printing to console during development or an observability vendor. The key point is that OTel decouples instrumentation from the backend. You instrument your code once, then choose where to send the data. This means you get the flexibility to start small with any vendor and switch up as you scale to vendors that are better suited for your needs.
To understand OTel in more depth, I highly suggest you to give this a read.
Copy, Paste & Run Example
Let me take you through a small exercise that can quickly show you the power of OpenTelemetry.
Say you have any application, it could be a side project or a micro-service you are an owner of [just start a new branch 🤷🏻♀️]. Since Python is a highly common language, the next couple of instructions will be for a Python application, but a simple Google search or LLM input would help to tweak this to any language of your choice.
Create and activate a virtual environment
Run the following commands, in the given sequence,
pip install opentelemetry-distro

pip install flask requests

opentelemetry-bootstrap -a install

opentelemetry-instrument --traces_exporter console --metrics_exporter console --logs_exporter console python server_automatic.py
You just completed a very basic instrumentation of your Python application, and you should be seeing traces, metrics and logs getting output to your console!
⚠️ Reminder
Reminder: This is a very basic example of instrumentation. OpenTelemetry has way more potential and power, but this is a starter example to quickly give you a hands-own experience on how instrumentation with OpenTelemetry feels like, and what kind of telemetry data can you collect.
Beating the OpenTelemetry Learning Curve
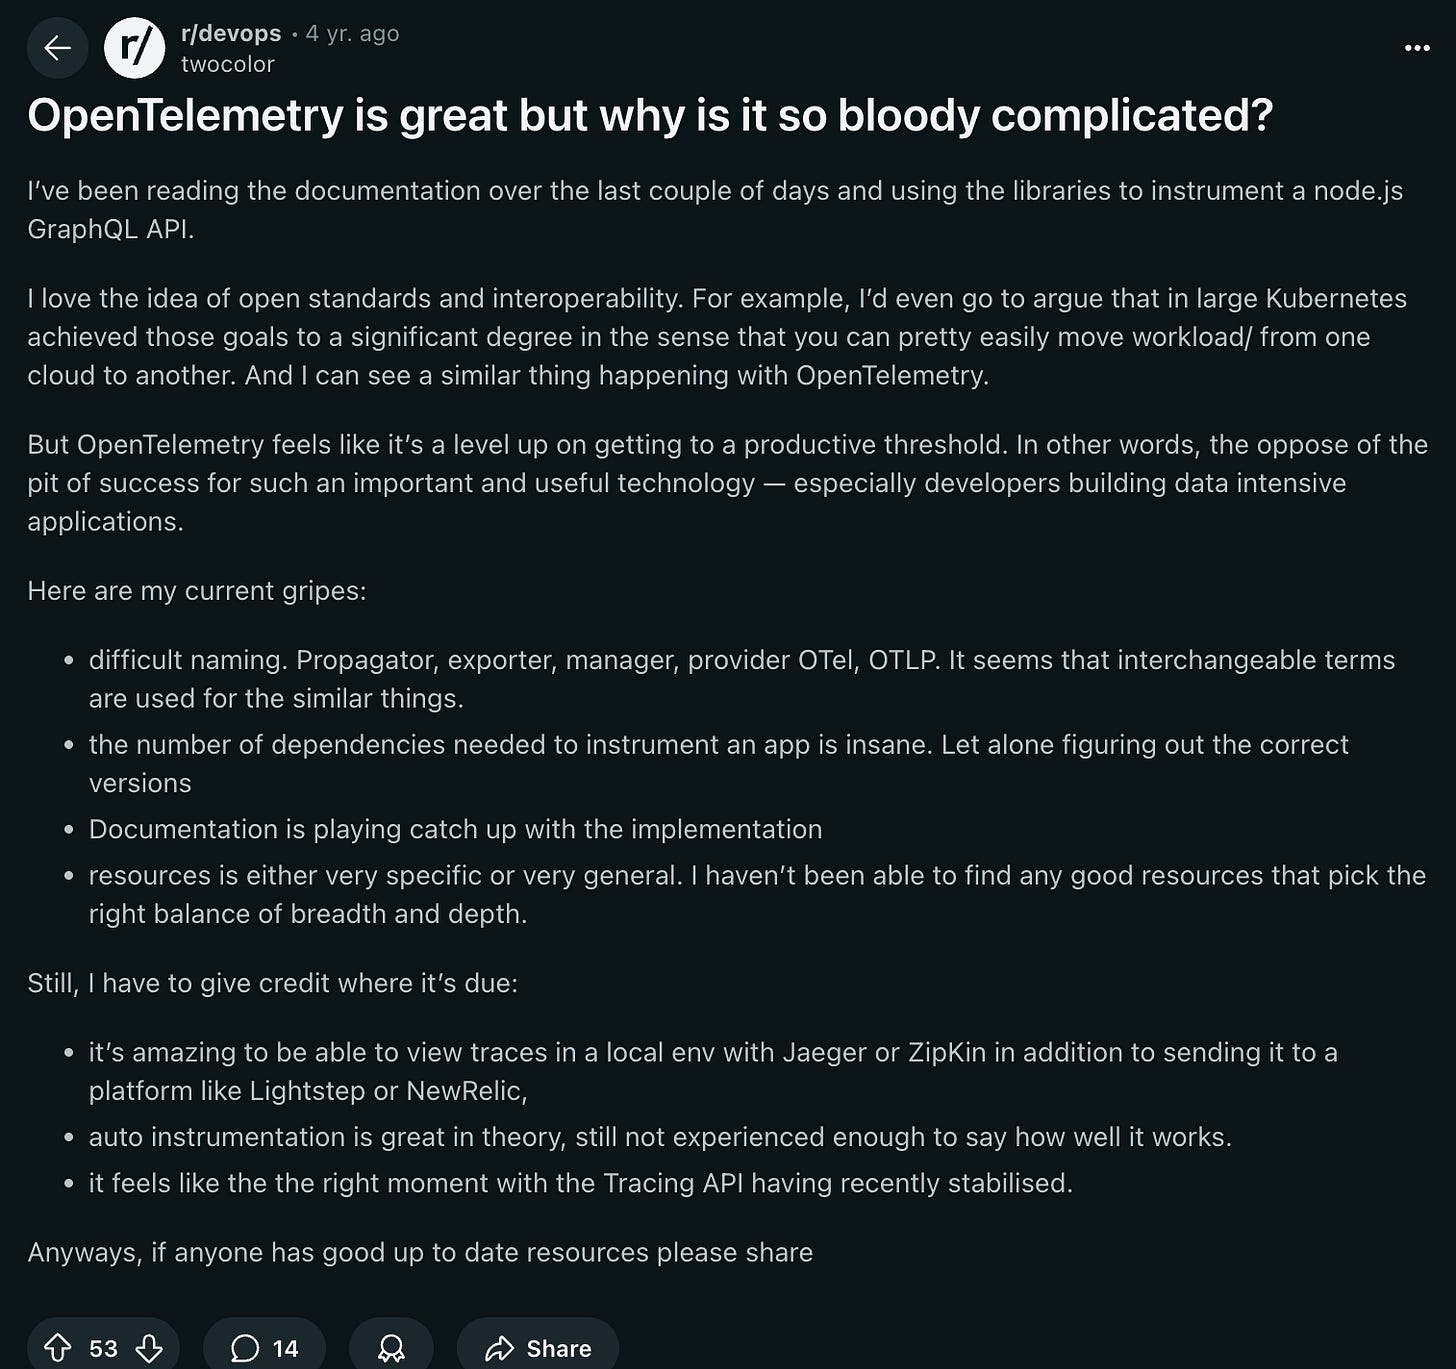
Like almost any other skill in life, OpenTelemetry also has quite a learning curve. In fact, there is a whole Reddit thread titled “OpenTelemetry is great, but why is it so bloody complicated?”.

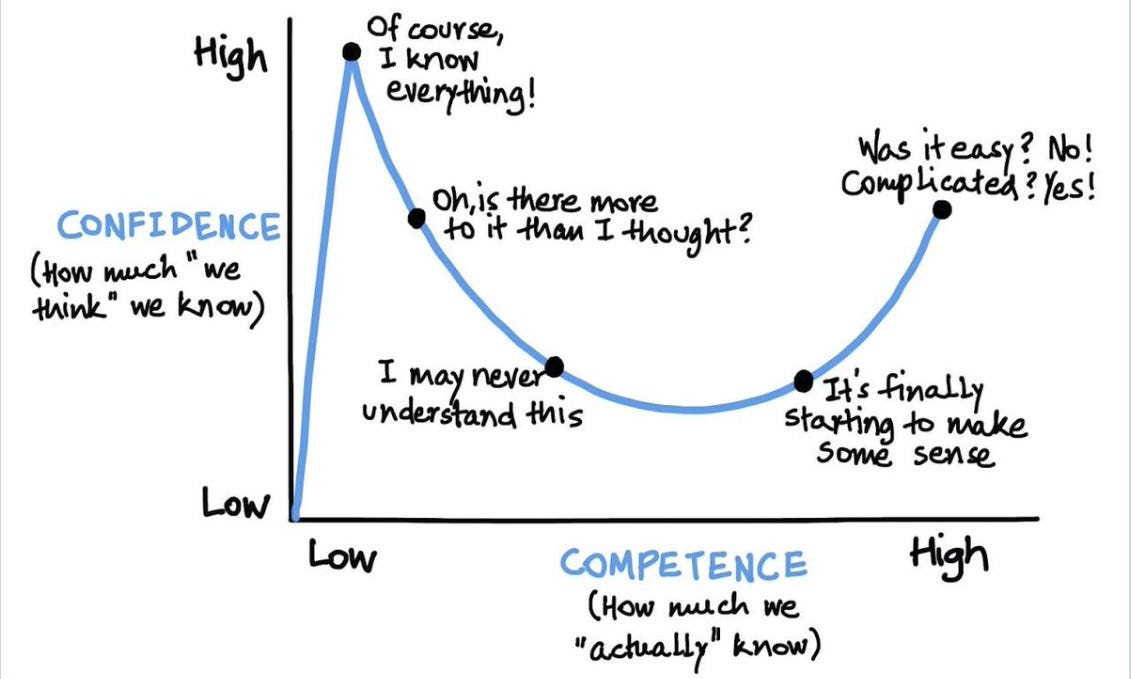
Depending on how deeply you want to observe your application, the complexity can vary. For instance, getting started with an example shown above is very easy, but the moment you dive deeper into traces, logs, metrics, spans, etc., it can become overwhelming. I’d like to introduce you to the Dunning-Kruger curve of confidence vs. competence.

I just wanted to tell you not to be discouraged. This steep ramp-up is common, and with a step-by-step approach, you will get comfortable with the concepts over time.
I highly suggest following our Blog series on OpenTelemetry, which has articles on almost every topic related to OpenTelemetry.
Next steps..
So where do you go from here?
Review your side projects
First, review your current projects or side projects and assess your observability gaps. Are you logging enough information? Do you have metrics for key behaviours? If not, that’s a great place to begin. Start instrumenting gradually using the tools and tips above. Consider implementing OpenTelemetry in one service and showcasing a trace to your team; it might inspire wider adoption once they see the value.
Make Observability a Habit
Next, consider making observability a habit in your development workflow. For instance, when reviewing code or designing new components, include observability questions in the process [e.g., “How will we know if this fails in production?”]. Over time, you and your team will naturally build more observable systems. This proactive approach eventually pays off by reducing nasty surprises and shortening debug sessions when issues do occur. Keep learning and stay updated. The observability landscape is evolving [with improvements in OpenTelemetry, new analysis tools, etc.], and being knowledgeable will set you apart. Follow a couple of observability blogs or community forums [the r/observability subreddit, devops blogs, CNCF talks] to see what challenges others are solving.
Embrace the Ownership Mindset
Finally, embrace the mindset*: as a developer, caring about observability means caring about your software beyond just writing code. It’s about owning the reliability and performance of what you build. In 2025 and beyond, the ability to quickly understand and fix issues in complex systems is gold. By investing in observability and tools like OpenTelemetry, you’re essentially future-proofing your career and your projects. So grab that playbook, get your hands dirty with some telemetry, and start turning those unknown unknowns into well-understood knowns. Your users [and your on-call self] will thank you!
